Catalog/Наружные сети (газ, электрика и т.д.)/Organization and Technology of Water Sup...
CONSTRUCTION TECHNOLOGY CARD
Наружные сети (газ, электрика и т.д.)
Organization and Technology of Water Supply and Sewerage Pipeline Installation
1 sections52 figures
1
Content
Leningrad Construction Committee PKI Leninzhstroyproekt
ORGANIZATION AND TECHNOLOGY OF WATER SUPPLY AND SEWERAGE PIPELINE INSTALLATION
Album of Technological Cards 13-2587-106544-TK
Chief Engineer of PKI Makovetsky M.M.
Head of Department Galaudin V.I.
CONTENTS
Name of technological cards
GENERAL PART
PREPARATORY PERIOD WORKS
1. Scope of application
2. Obtaining a permit for the execution of works and main responsibilities of the site supervisor prior to the start of construction
3. Staking out design alignments in the field (geodetic setting-out works)
4. Fencing of the work site, installation of traffic signs and indicators
5. Demolition of above-ground structures and relocation of green plantings
6. Site grading, surface water drainage
7. Construction of temporary roads
8. Provision of construction sites with sanitary and welfare facilities and firefighting equipment
9. Lighting of construction sites
10. Acceptance and storage of construction materials, products, and structures on site, incoming quality control
11. Potholing of existing underground utilities
EARTHWORKS
2. Preparation of frozen soils for excavation
3. Dismantling of road pavements
4. Soil excavation by excavators
5. Soil excavation at intersections with existing utility lines
6. Execution of works at intersections with tram or railway tracks
7. Excavation of pits (bell holes)
8. Shoring of vertical walls of trenches and pits
9. Open dewatering and groundwater lowering
10. Preparation of the subgrade
11. Backfilling of trenches and pits
12. Basic health and safety requirements for earthworks
13. Scheme of operational quality control for earthworks
INSTALLATION OF WATER SUPPLY AND SEWERAGE PIPELINES AND ASSOCIATED STRUCTURES
2. General provisions
3. Installation of steel pipes
4. Insulation of steel pipeline joints
5. Installation of reinforced concrete pipes
6. Installation of cast iron pipes
7. Installation of plastic pipes
8. Installation of manholes (chambers)
9. Installation of shut-off valves
10. Basic health and safety requirements for the installation of pipelines and associated structures
11. Scheme of operational quality control for the installation of pipelines and associated structures
HYDRAULIC TESTING OF WATER SUPPLY AND SEWERAGE PIPELINES
2. Testing of gravity pipelines
3. Testing of pressure pipelines
4. Flushing and disinfection of domestic and drinking water supply pipelines
CONNECTION OF WATER SUPPLY AND SEWERAGE PIPELINES TO THE EXISTING NETWORK, WASTEWATER PUMPING
2. Connection using a tee
3. Connection using a coupling
4. Tapping using a saddle
5. Tapping using a cutter
6. Connection of a sewer to an existing manhole
7. Connection of a sewer with manhole installation and wastewater pumping
8. Installation of a temporary sewer network for wastewater pumping
9. Basic health and safety requirements for executing works on existing sewer networks
LOADING, UNLOADING, AND TRANSPORTATION WORKS
2. Working techniques for loading and unloading various construction cargoes
3. Technology and organization of
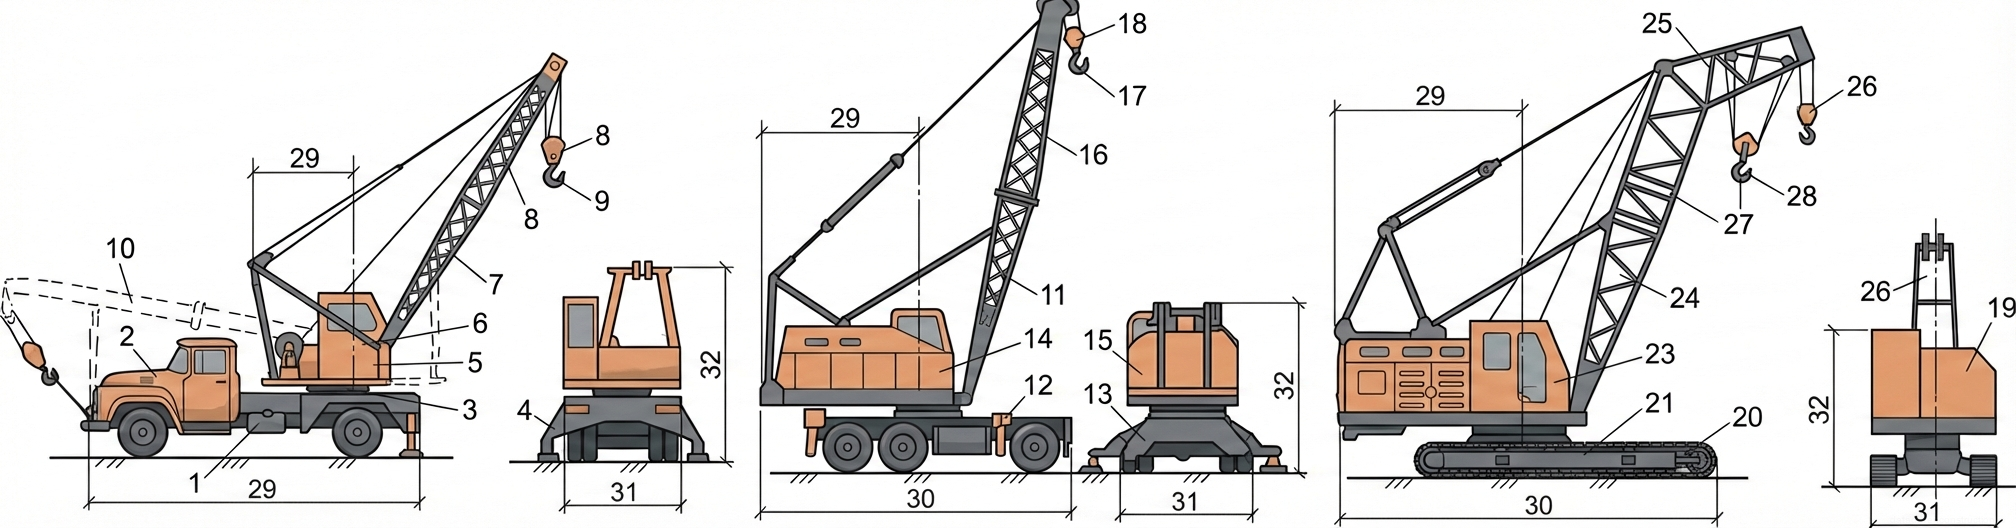
Fig. 1 — General arrangement and structural components of mobile lifting equipment: truck-mounted, pneumatic-tired, and crawler lattice-boom cranes
1Commercial truck chassis, steel frame construction, serves as the highly mobile road-legal base platform for the truck-mounted crane
2Forward driving cab, standard steel and safety glass construction, houses the driver during road transit
3Rear hydraulic outrigger, steel construction with extension beam, deployed to provide lateral stability during lifting operations
4Outrigger ground pads, reinforced steel, distributes concentrated crane point loads to the ground to prevent overturning
5Slewing bearing and rotating superstructure bed, heavy-duty steel, supports and rotates the crane boom, cab, and counterweight
6Crane operator's cabin, enclosed steel frame, provides optimal visibility and houses dedicated control systems during lifting operations
7Base section of the main lattice boom, welded high-strength tubular steel, serves as the primary load-bearing lifting structure
8Boom hoist pendant lines, high-tensile steel wire rope, controls the elevation and working angle of the lattice boom
9Main lifting hook block, cast steel assembly with internal sheaves, provides the primary connection point for heavy lifting
10Stowed lattice boom, shown in horizontal transport configuration to meet road travel height and stability clearances
11Main lattice boom base, high-strength steel angles and tubes, supports primary lifting operations for the pneumatic-tired crane
12Multi-axle specialized pneumatic chassis, reinforced heavy steel frame, provides robust mobility across rough construction terrain
13Extended transverse outriggers, steel beam construction, essential for stabilizing the narrow chassis during heavy lifts
14Superstructure machinery enclosure, sheet metal paneling over steel frame, protects the internal diesel engine, hydraulic pumps, and winches
15Operator control cab (front view), steel framework with large windows, central operating station for slewing and hoisting
16Upper boom section, pinned tubular steel lattice, extends the total lifting height and reach of the crane assembly
17Main hoist wire rope, multi-strand high-tensile steel, transfers dynamic lifting loads from the winch drum to the hook
18Heavy-duty hook block, solid cast steel housing with safety latch, engages the rigging of the lifted load
19Rear counterweight assembly, solid steel or cast iron blocks, counteracts the overturning moment generated by suspended heavy loads
20Crawler track assembly, heavy-duty steel links and track pads, provides low ground-bearing pressure and high off-road traction
21Crawler carbody (lower works), massive welded steel fabrication, transfers the entire weight and dynamic lifting loads to the tracks
23Crawler crane operator's cab, steel construction, mounted forward on the slewing bed for direct line-of-sight to the load
24Primary lattice boom, welded steel truss structure, serves as the main structural lifting arm for high-capacity crane operations
25Fixed jib extension, lightweight tubular steel truss, attached to the main boom tip to provide additional reach and offset clearance
26Auxiliary hook block / A-frame gantry (dual label), structural steel components, used for fast lifting of lighter loads and boom suspension management
27Boom suspension rigging and pendants, high-strength steel wire rope, securely supports the boom at the desired operating angle
28Main heavy-lift hook block, multi-sheave cast steel assembly, transfers maximum lift capacity from the main boom
29Dimension parameter (A), tail swing radius, indicates the clear operational zone required for unobstructed superstructure rotation
30Dimension parameter (L), overall operational or transport length, defines the longitudinal footprint of the equipment chassis
31Dimension parameter (B), overall track width or outrigger spread, dictates the transverse operational footprint required for stability
32Dimension parameter (H), overall transport height, critical dimension for evaluating overhead road clearance and site access constraints
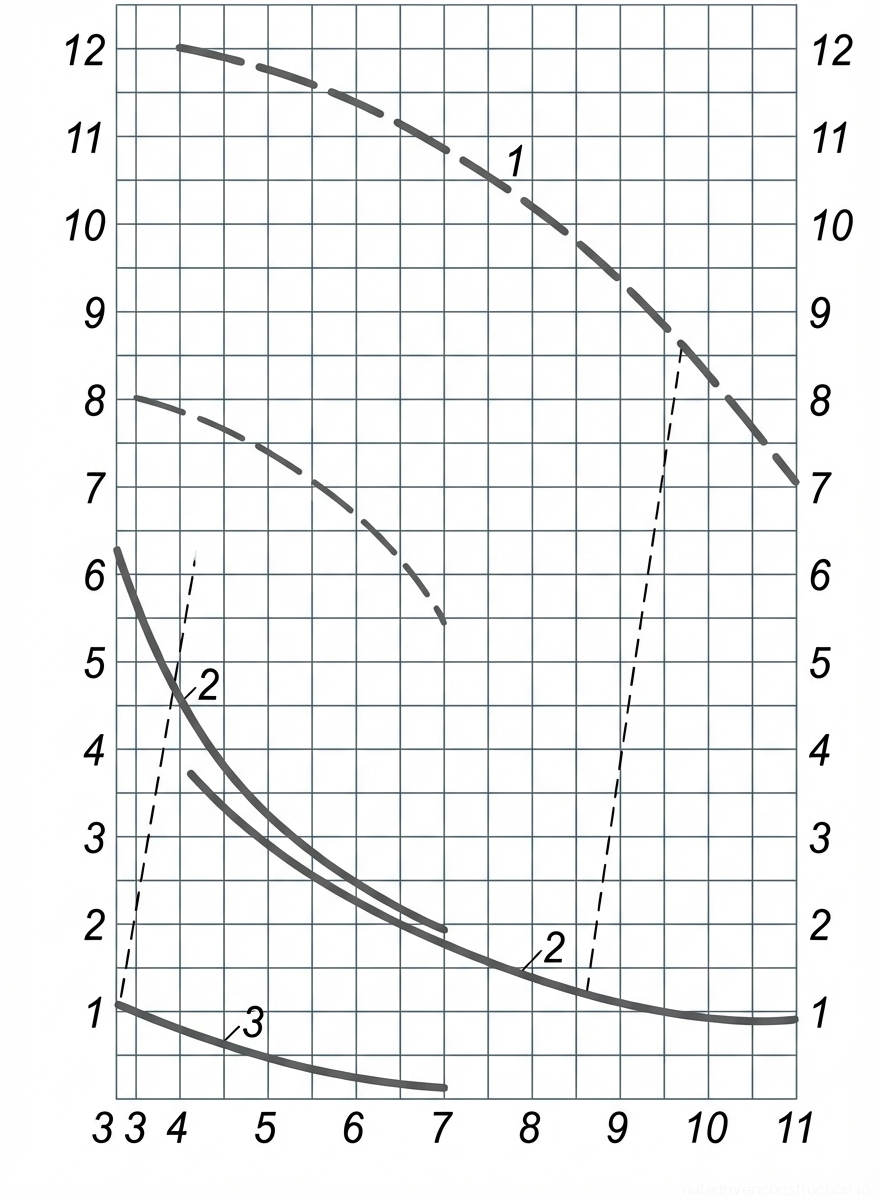
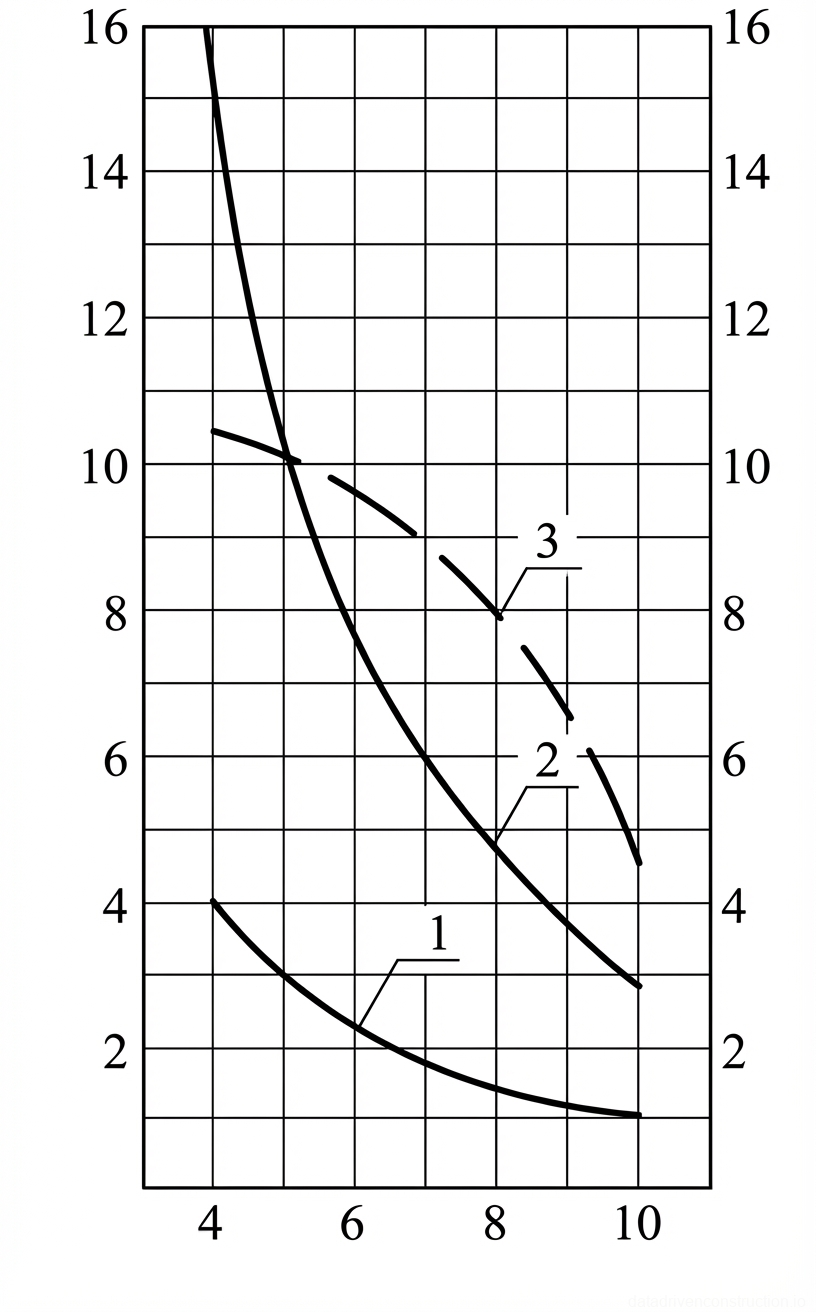
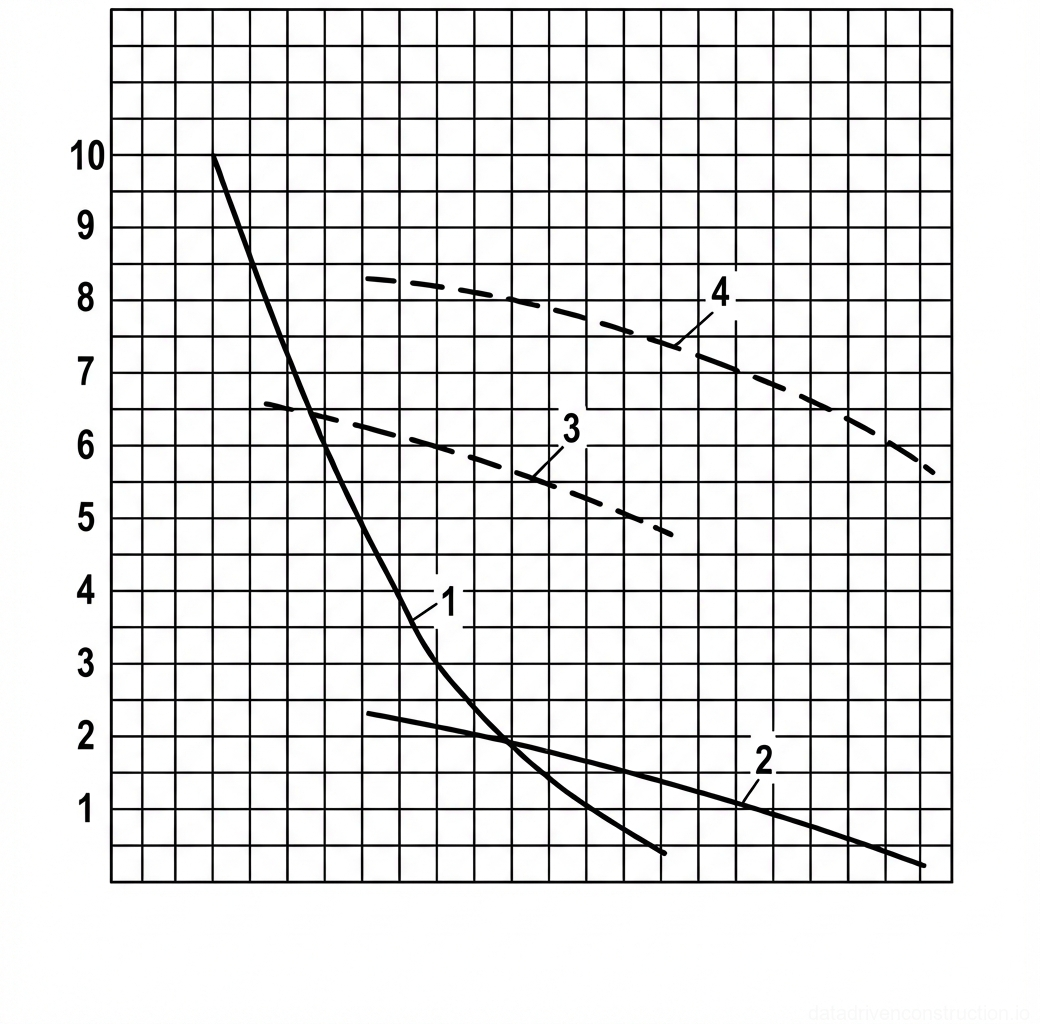
Fig. 2 — Load characteristic and lifting height curves for a crane based on boom radius
1Dashed curves representing the lifting height of the hook (in meters) for different boom lengths (e.g., L_boom = 12m and L_boom = 8m), plotted against the boom radius.
2Solid curves indicating the lifting capacity (in tons) when operating on outriggers for respective boom lengths, showing the inverse relationship between load capacity and boom radius.
3Solid curve showing the reduced lifting capacity (in tons) when operating without outriggers, demonstrating lower load limits across the operating radii.
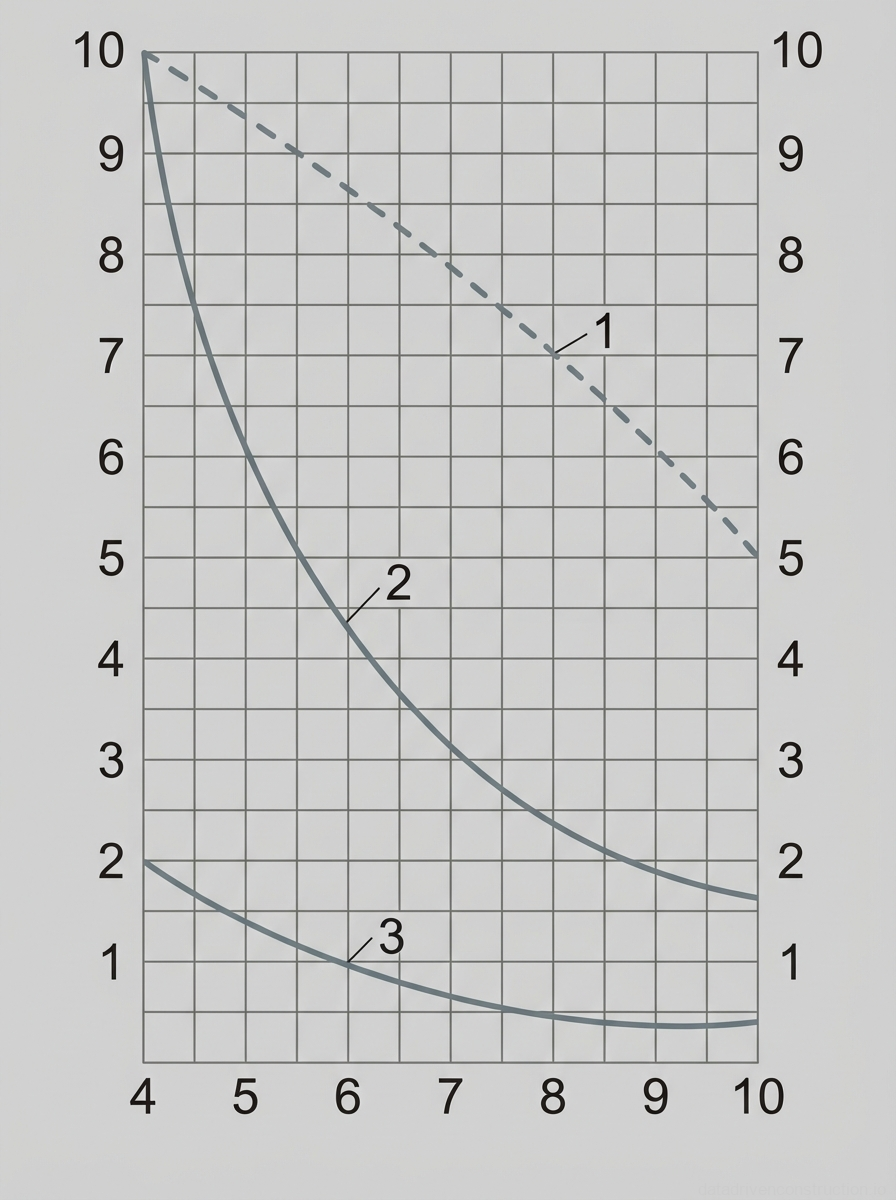
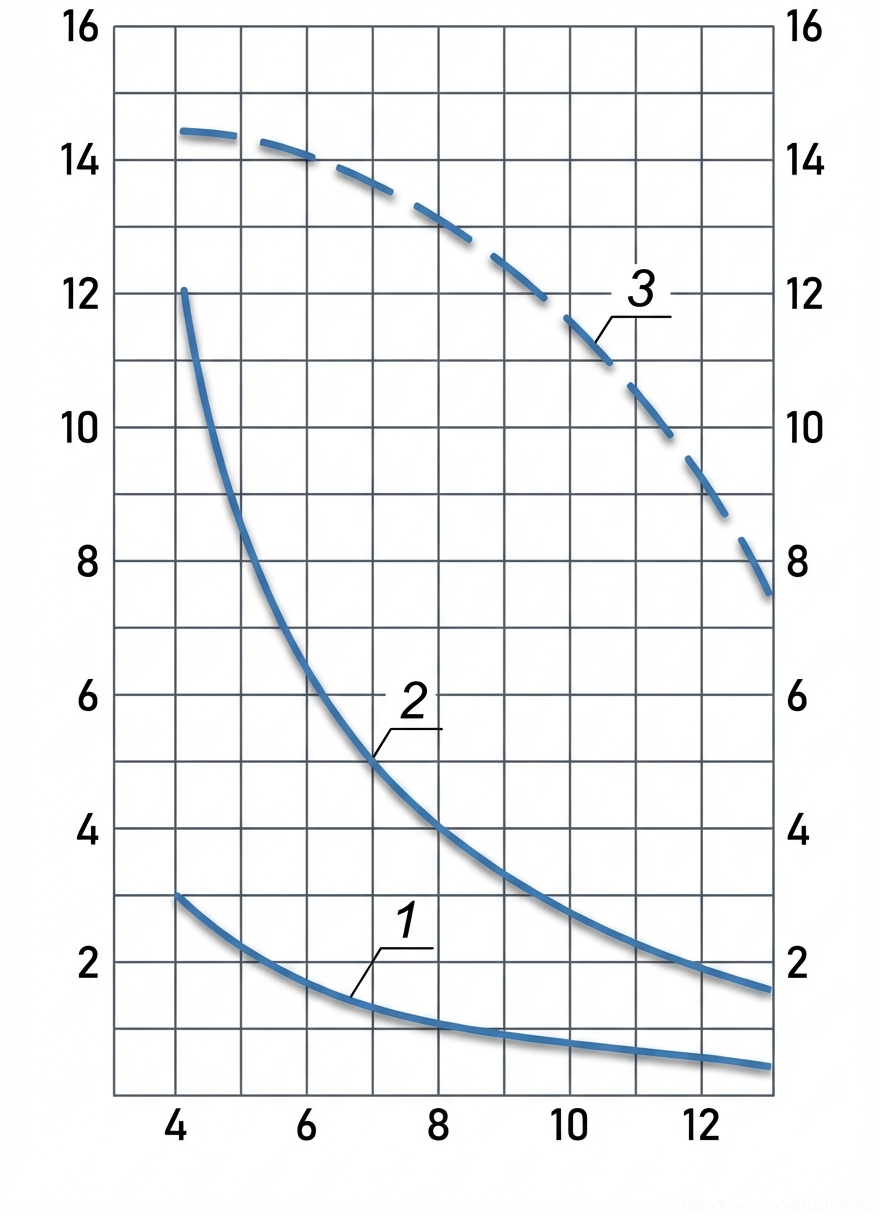
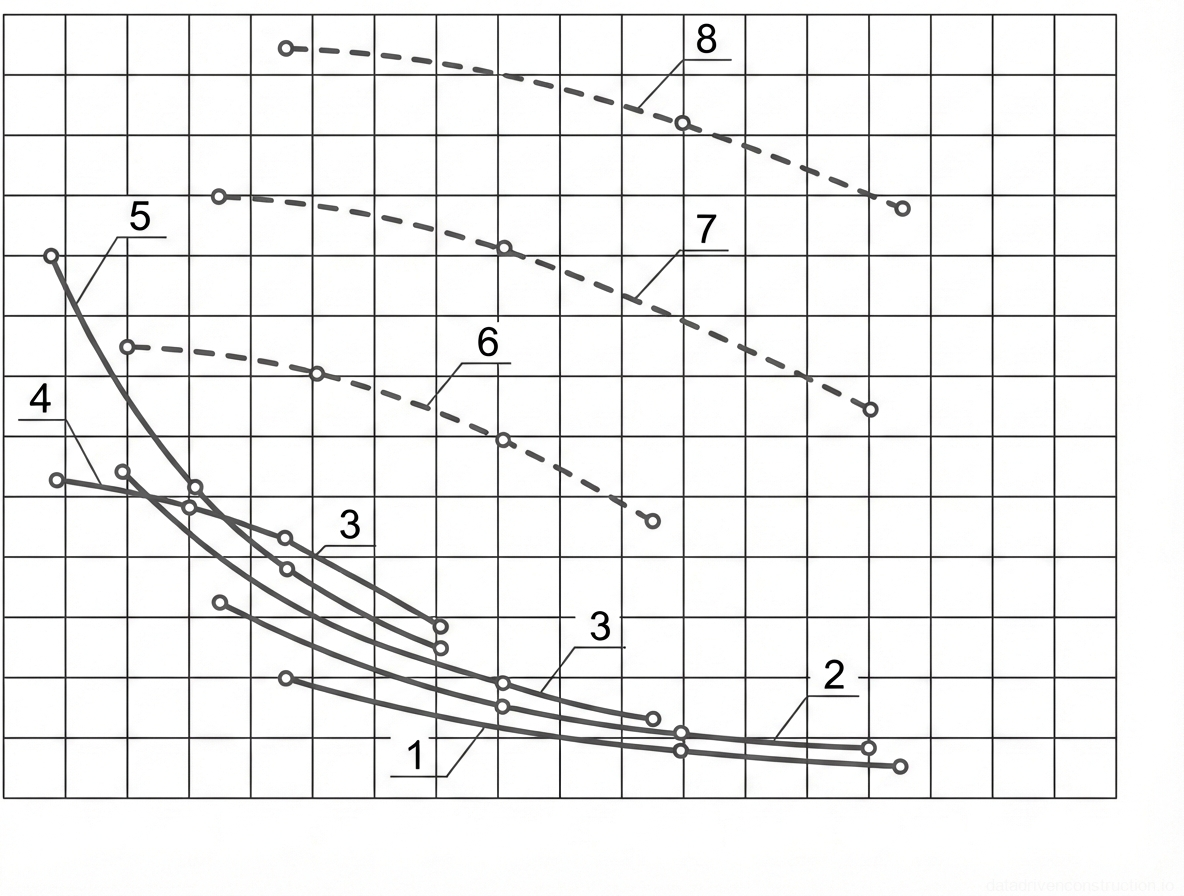
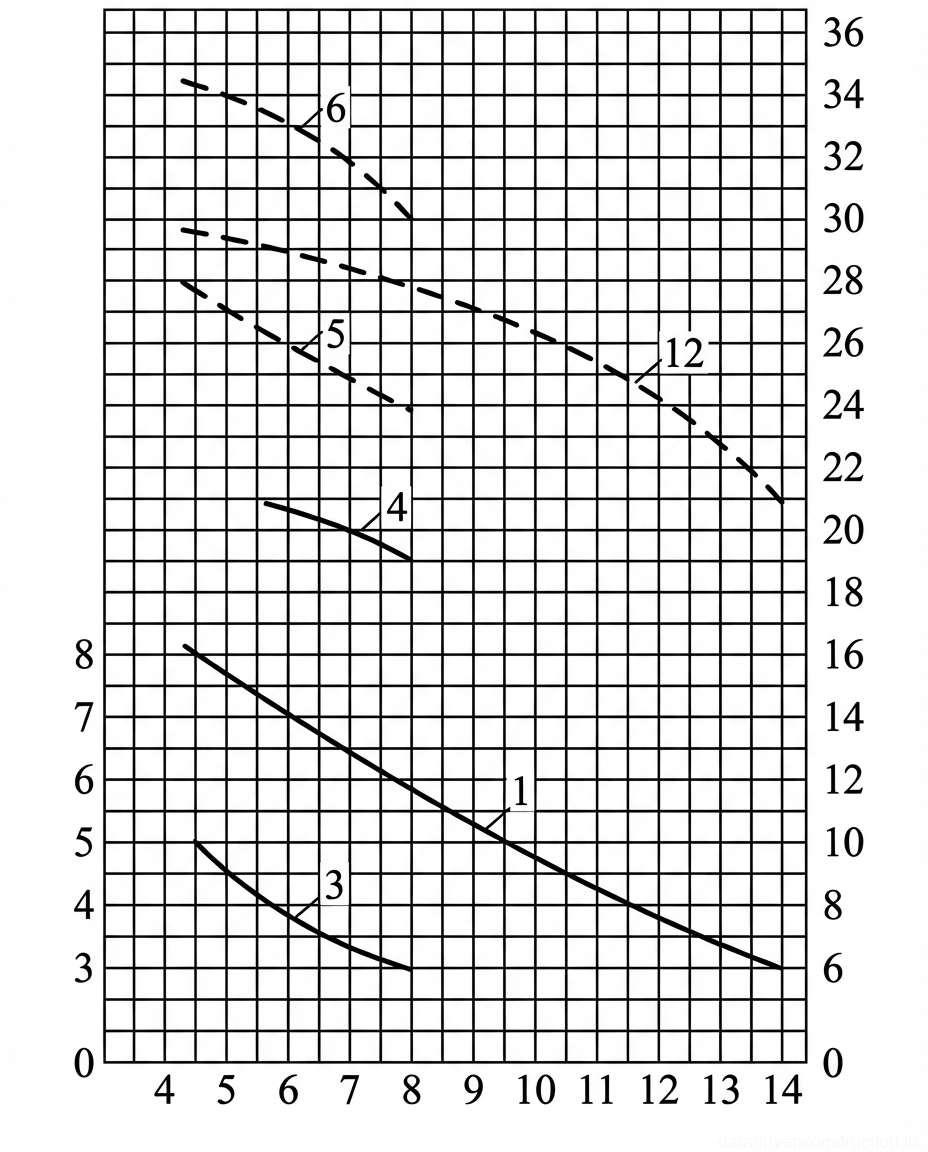
Fig. 3 — Load chart demonstrating the relationship between boom radius (m), lifting capacity (t), and hook lifting height (m)
1Dashed curve indicating the hook lifting height (m) relative to the boom radius, scaled on the right vertical axis.
2Solid curve representing the primary lifting capacity (t) as a function of the boom radius (m), scaled on the left vertical axis.
3Secondary solid curve representing an alternative or reduced lifting capacity (t) for specific operating conditions, also scaled on the left vertical axis.
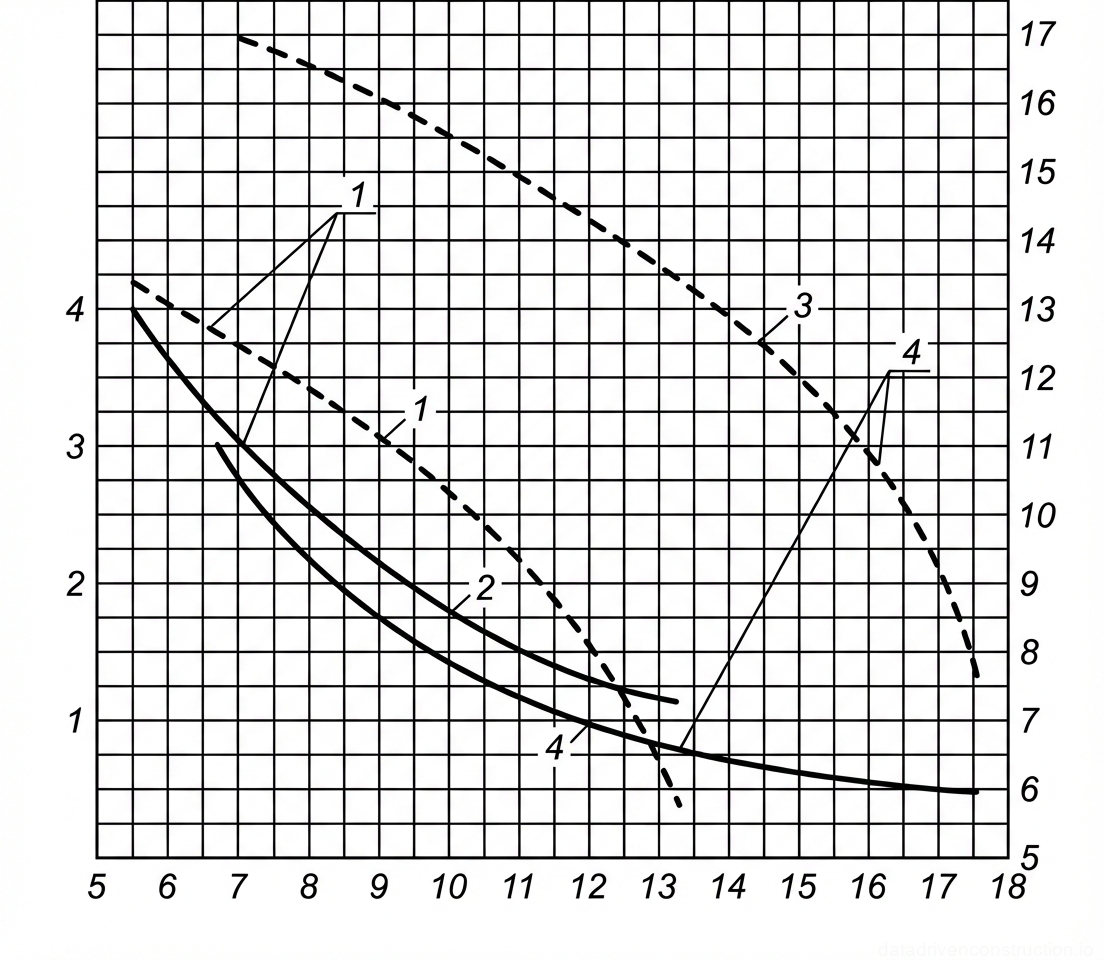
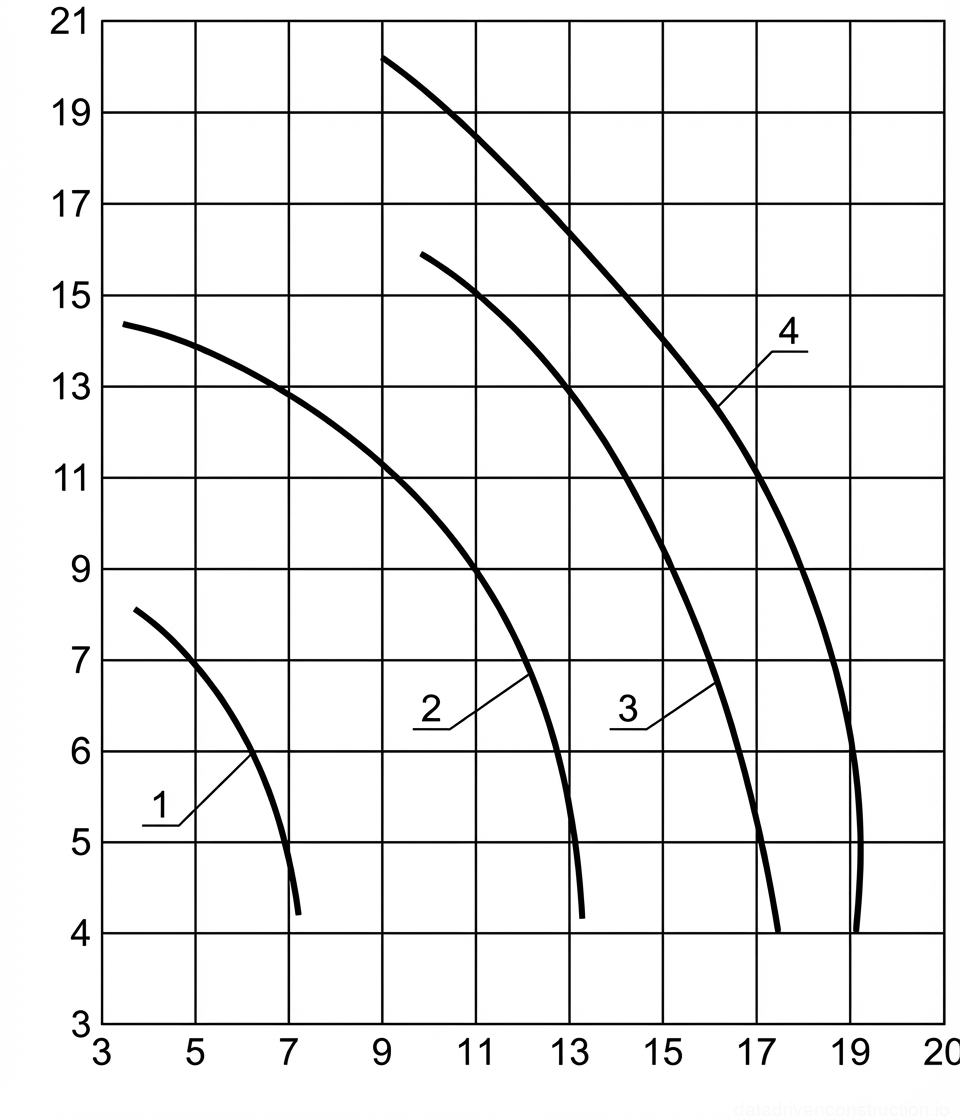
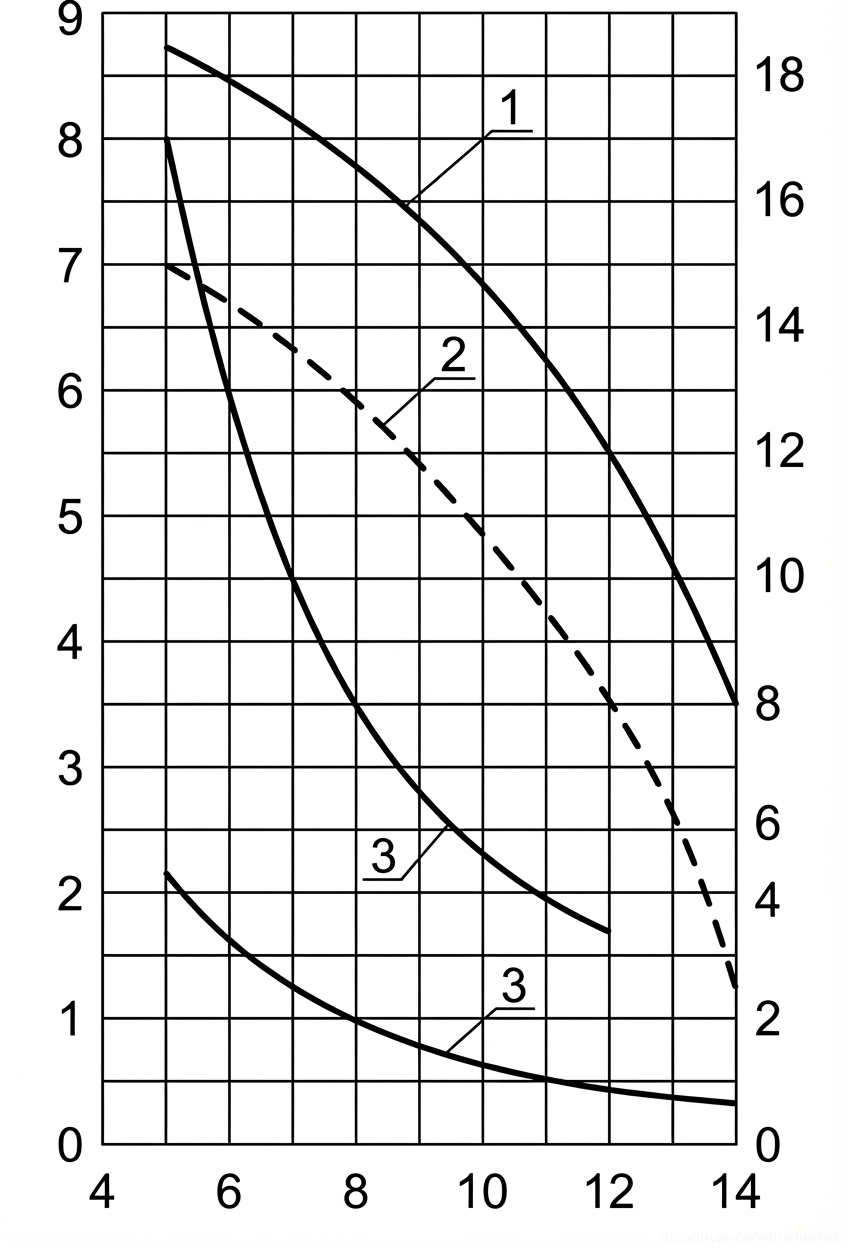
Fig. 4 — Crane load chart detailing lifting capacity and hook lifting height as functions of boom outreach for boom lengths of 14m and 18m.
1Curve indicating hook lifting height for a boom length of 14 meters (dashed line)
2Curve indicating lifting capacity for a boom length of 14 meters (solid line)
3Curve indicating hook lifting height for a boom length of 18 meters (dashed line)
4Curve indicating lifting capacity for a boom length of 18 meters (solid line)
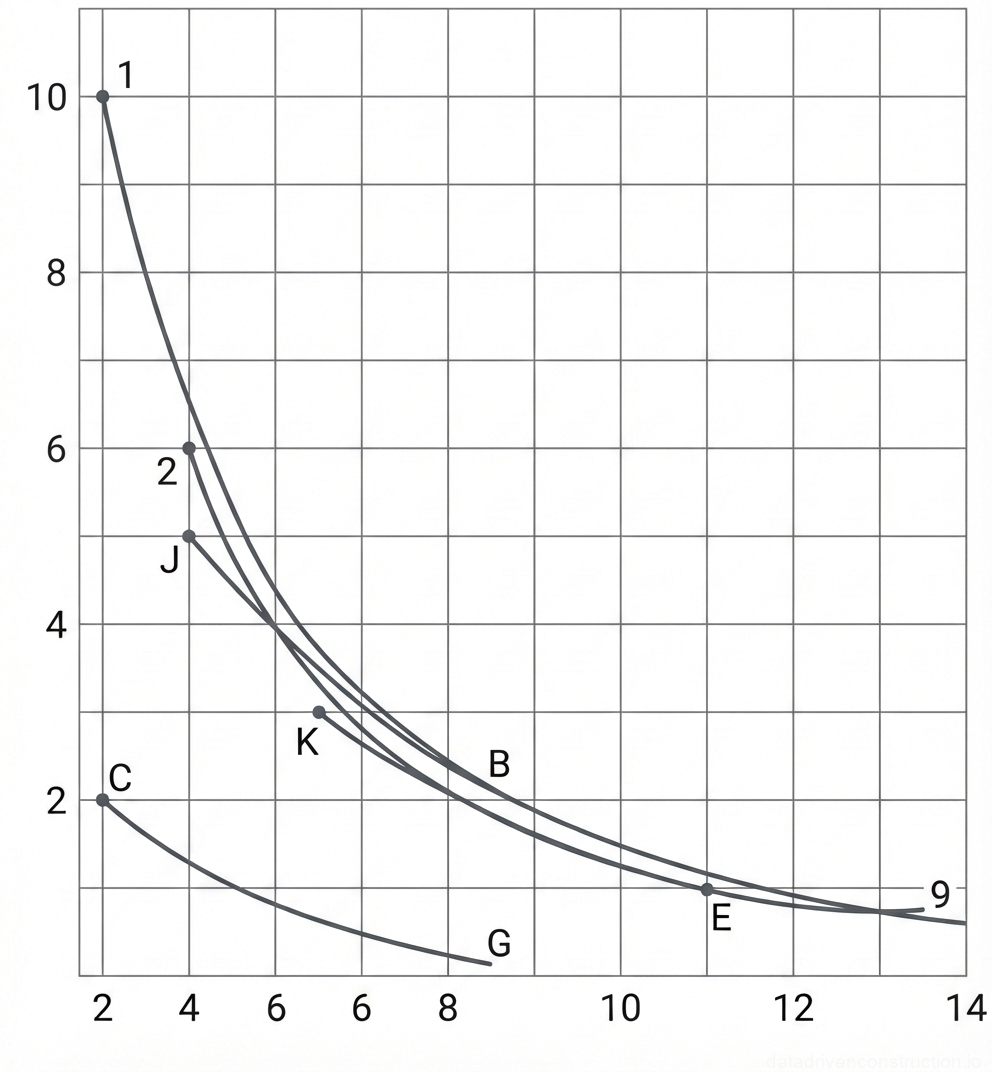
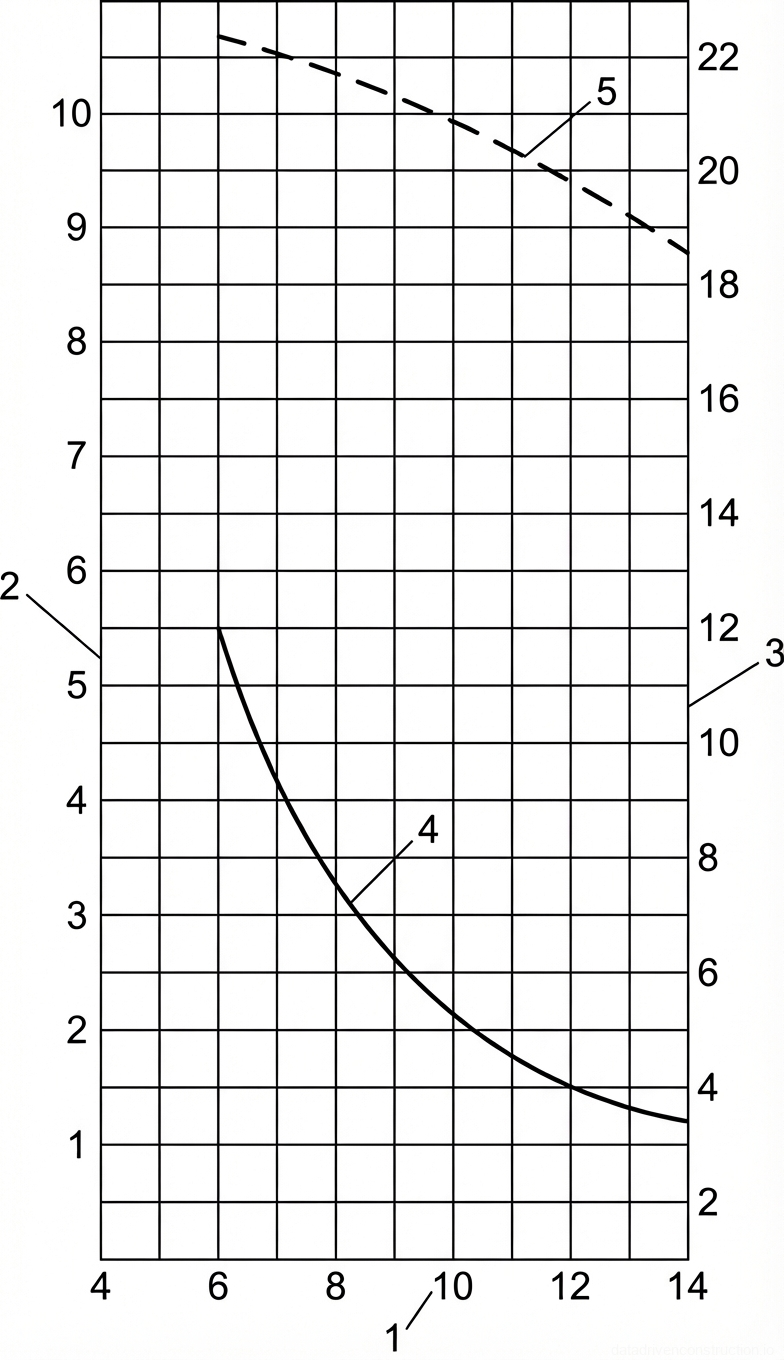
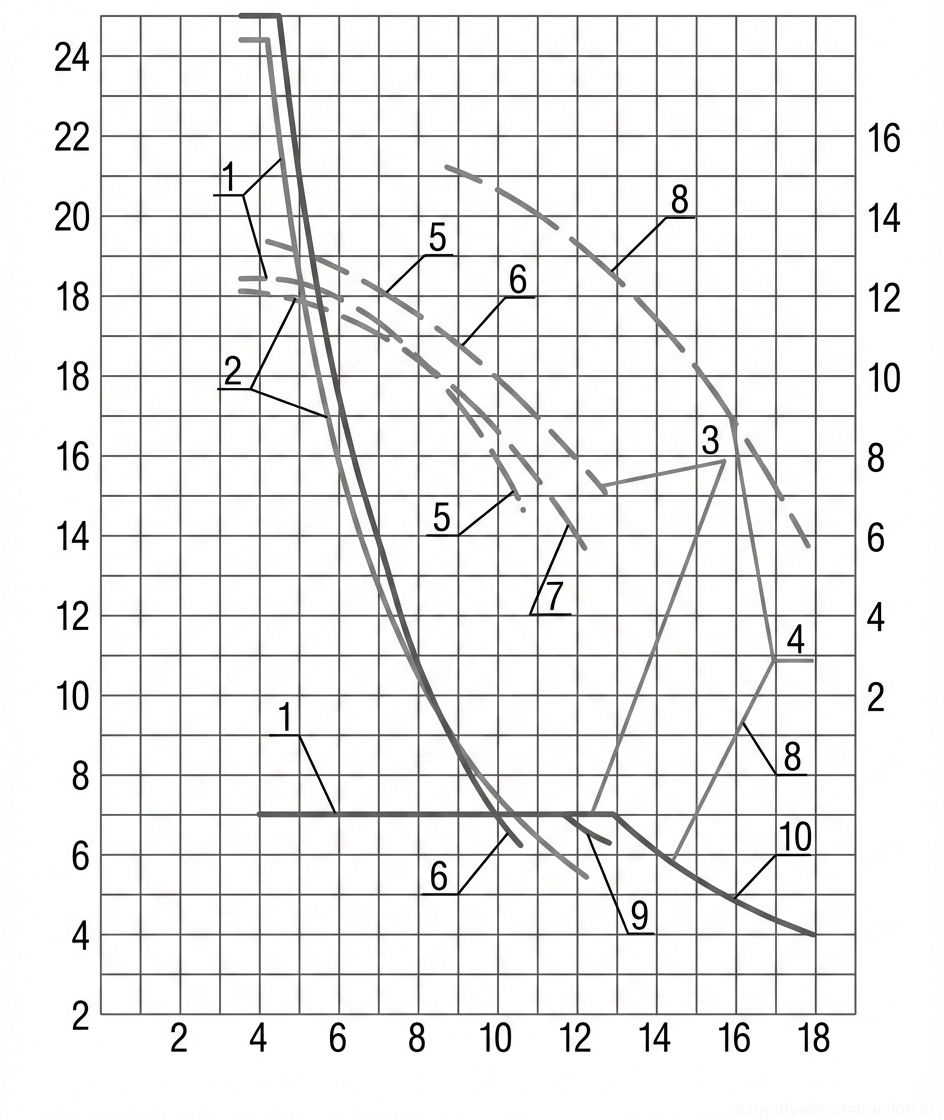
Fig. 5 — Crane load-radius chart showing lifting capacity as a function of jib outreach for various operational configurations
1Point A: Maximum lifting capacity point (10t) at minimum jib outreach (approximately 3.2m)
2Point D (Д in original): Intermediate load capacity point (6t) on a secondary load curve at 5m outreach
9Point L (Л in original): End point of a primary load curve indicating minimum capacity (approx. 0.8t) at maximum outreach (approx. 13.5m)
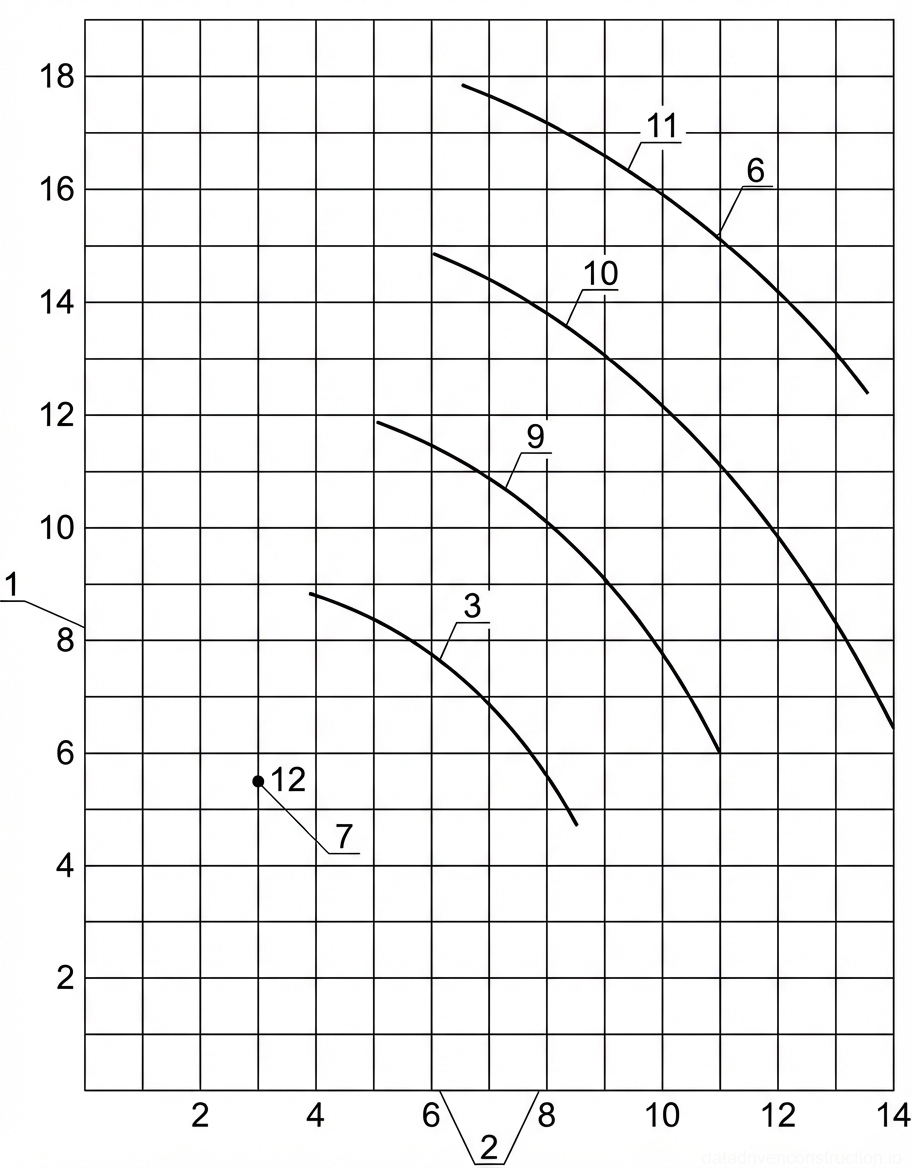
Fig. 6 — Crane lifting height versus boom outreach performance chart showing operational curves for various boom configurations
1Vertical axis representing hook lifting height (Высота подъема крюка, м) in meters
2Horizontal axis representing boom outreach (Вылет стрелы, м) in meters
3Curve I: Lifting height vs. outreach performance curve for the first boom configuration (shortest boom)
6Grid lines for performance chart, spaced at 2m intervals vertically and 2m intervals horizontally
7Point M: A specific data point indicating a required lifting height and outreach coordinate
9Curve II: Lifting height vs. outreach performance curve for the second boom configuration
10Curve III: Lifting height vs. outreach performance curve for the third boom configuration
11Curve IV: Lifting height vs. outreach performance curve for the fourth boom configuration (longest boom)
12Marker for Point M at approximately 3m outreach and 5.5m height
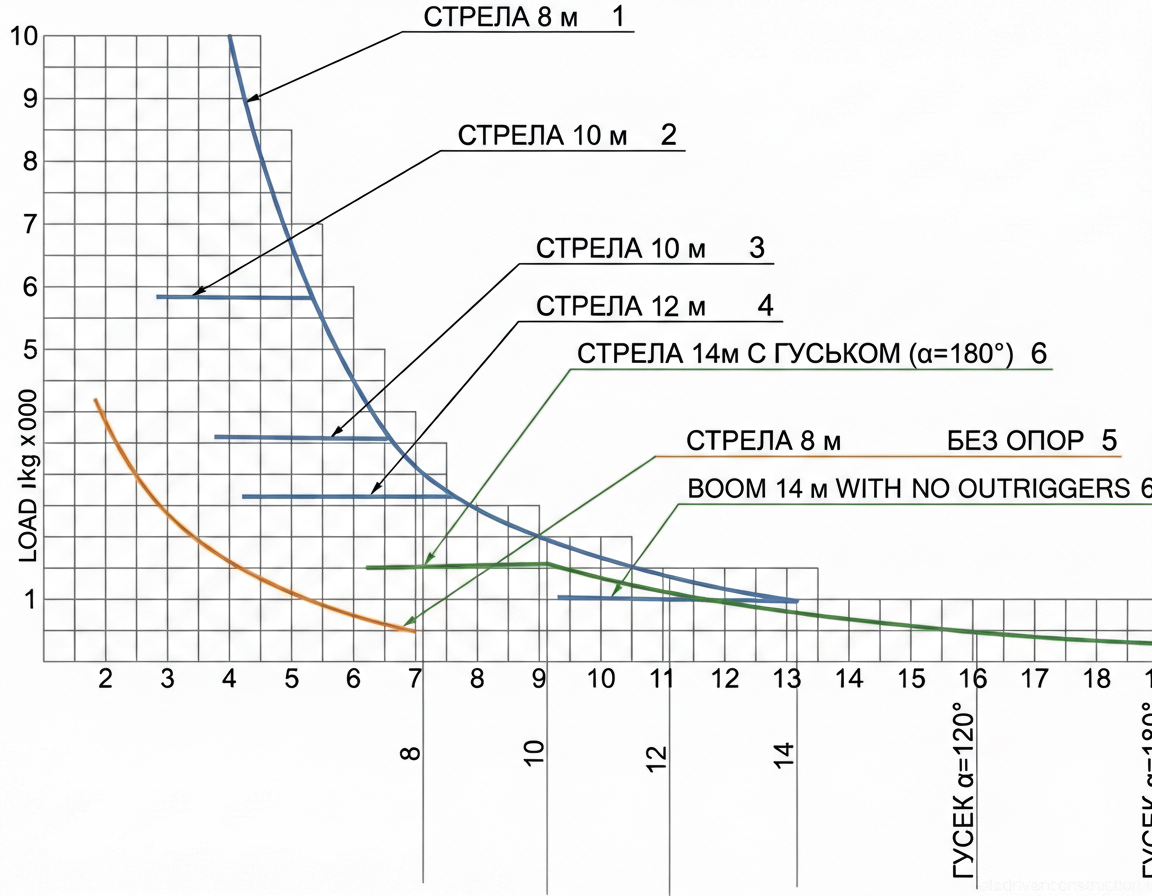
Fig. 7 — Load-lifting capacity chart for a mobile crane showing various boom lengths and jib configurations
1Load capacity curve for 8 m boom configuration, showing maximum safe lifting limits over its operational radius
2Load capacity curve for 10 m boom configuration, showing maximum safe lifting limits over its operational radius
3Load capacity curve for 12 m boom configuration, showing maximum safe lifting limits over its operational radius
4Load capacity curve for 14 m boom configuration, showing maximum safe lifting limits over its operational radius
5Load capacity curve for 8 m boom configuration operating without outriggers, indicating significantly reduced lifting capacity
6Load capacity curve for 14 m boom configured with a jib attachment set at a 180° angle (straight extension)
7Load capacity curve for 14 m boom configured with a jib attachment set at a 126° angle
Fig. 8 — Crane lifting height and outreach performance chart for various boom and jib configurations
1Curve representing the lifting height versus outreach for an 8m boom configuration
2Curve representing the lifting height versus outreach for a 14m standard boom configuration
3Curve representing the lifting height versus outreach for a 14m boom equipped with a jib set at an angle of α=126°
4Curve representing the lifting height versus outreach for a 14m boom equipped with a jib set at an angle of α=180°
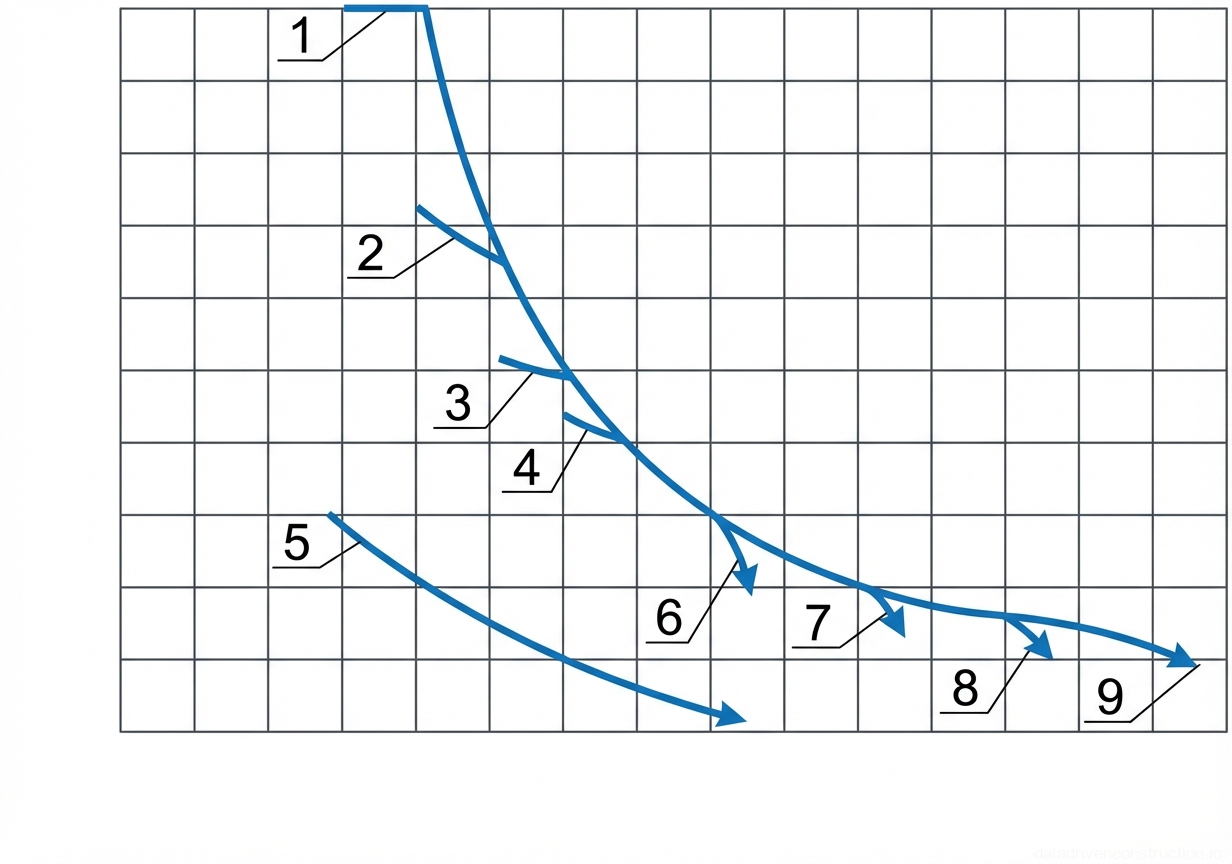
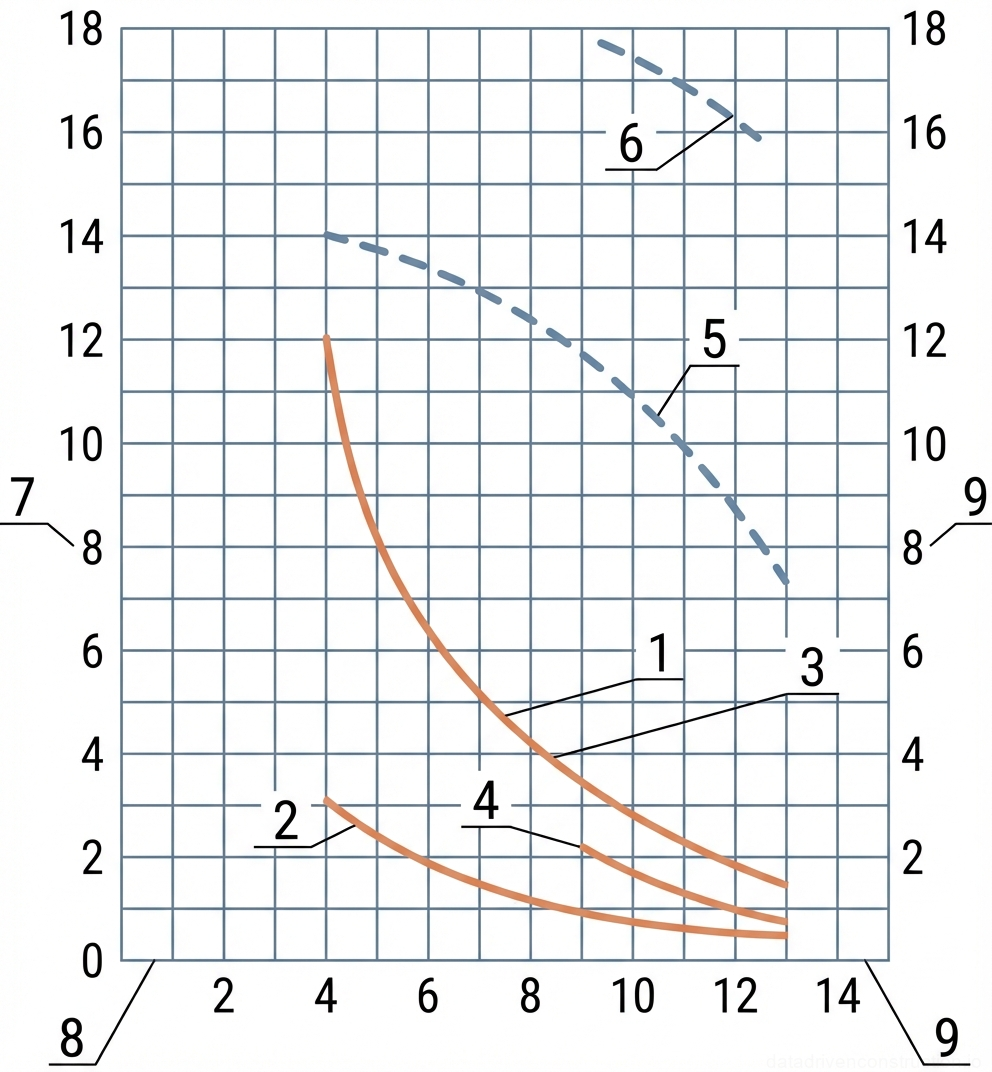
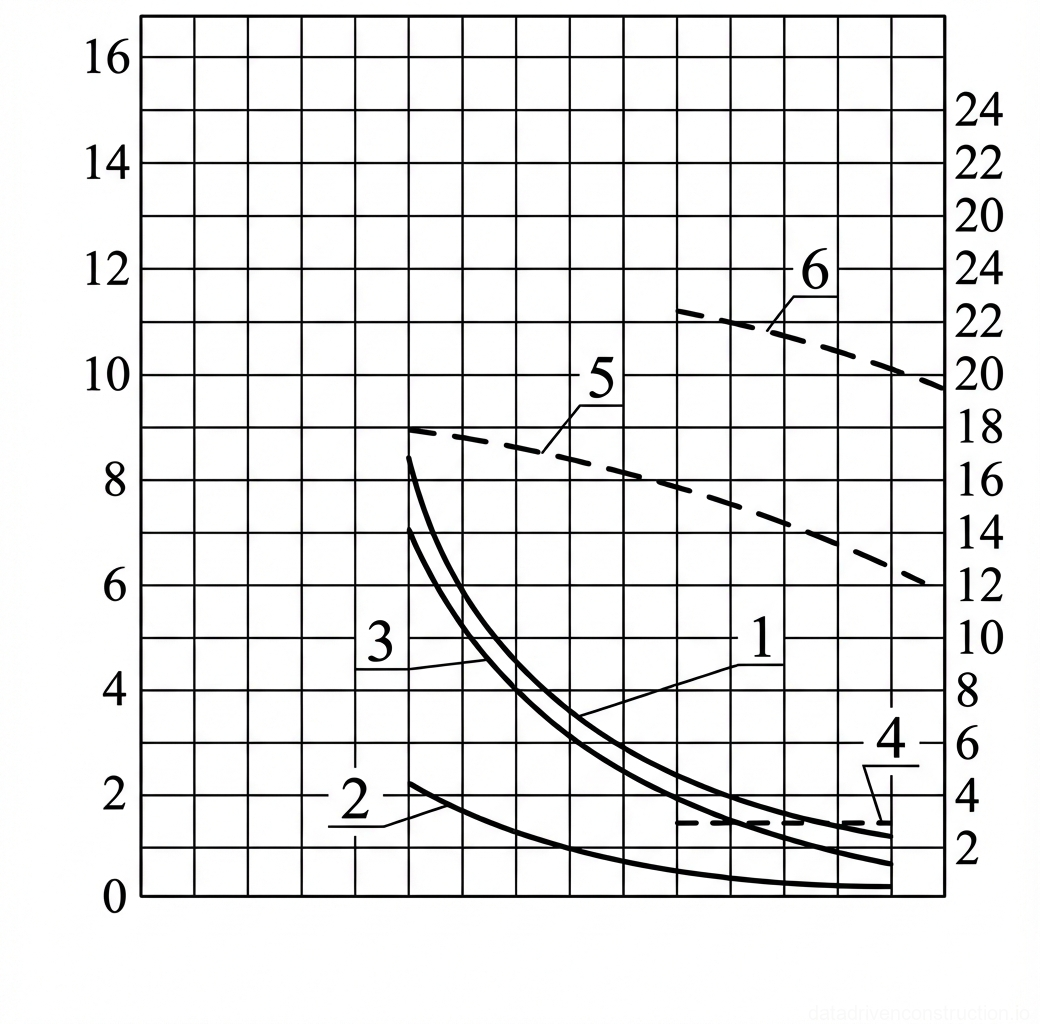
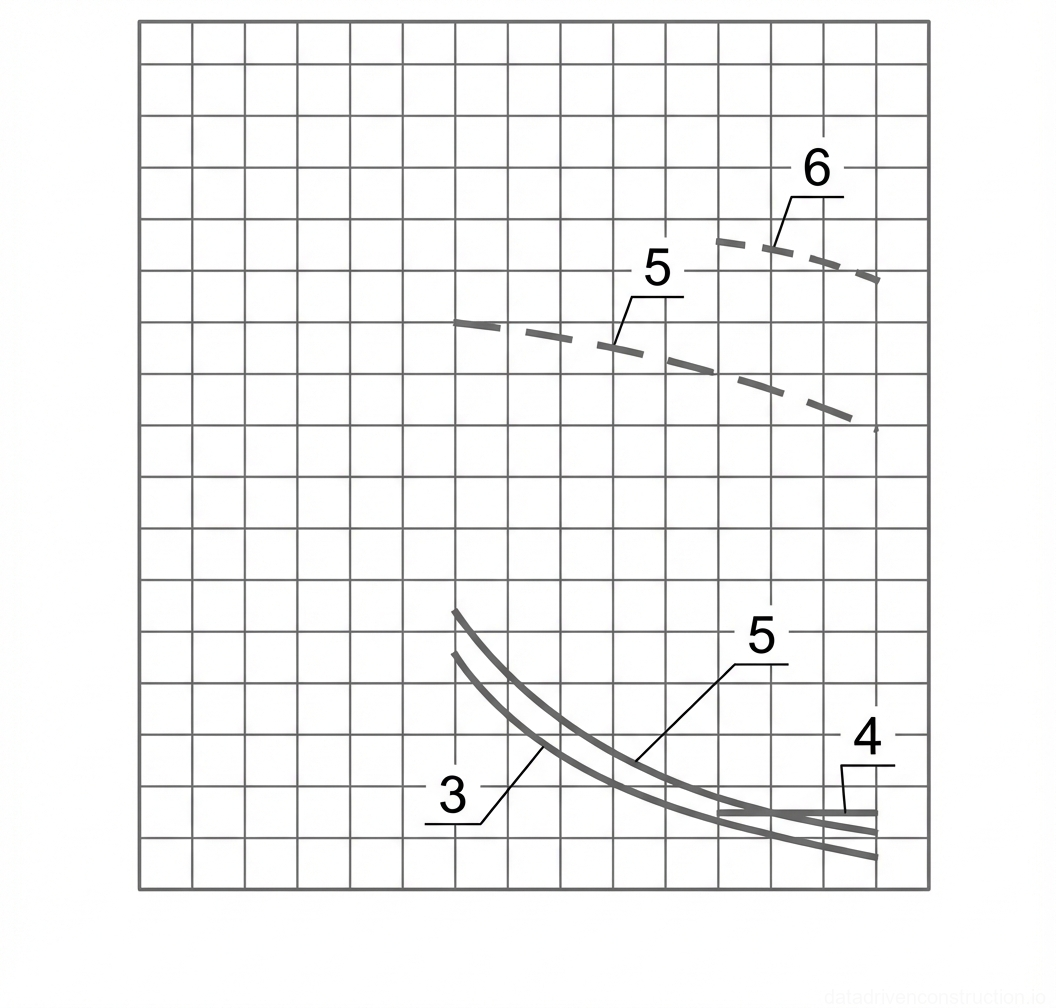
Fig. 9 — Crane load chart detailing lifting capacity versus working radius for multiple boom configurations
1Maximum lifting capacity segment at minimum working radius, representing the crane's peak structural and stability limits before the capacity begins to decrease with increased outreach.
2Intermediate load capacity curve segment, indicating the maximum allowable load for a specific boom length or configuration as the radius increases.
3Transitional point or specific configuration curve segment where lifting capacity drops further due to extended boom length or modified rigging.
4Further extension load curve segment, detailing capacity limits at greater outreach distances for an extended boom or specific jib attachment.
5Secondary, lower-capacity curve, likely representing operations with a different hoist mechanism (e.g., auxiliary hoist or whip line) or a significantly different boom configuration.
6Terminal point of a specific capacity curve, indicating the maximum permissible outreach for that particular load or boom setup before stability or structural integrity is compromised.
7Terminal point of an extended configuration curve, marking the furthest safe working radius for its corresponding lifting capacity.
8Maximum outreach point for a further extended boom or jib configuration, showing the limit of operation at that specific low load capacity.
9Absolute maximum outreach point on the primary load chart, representing the furthest possible working radius and the lowest corresponding safe lifting capacity for the crane's maximum extension.
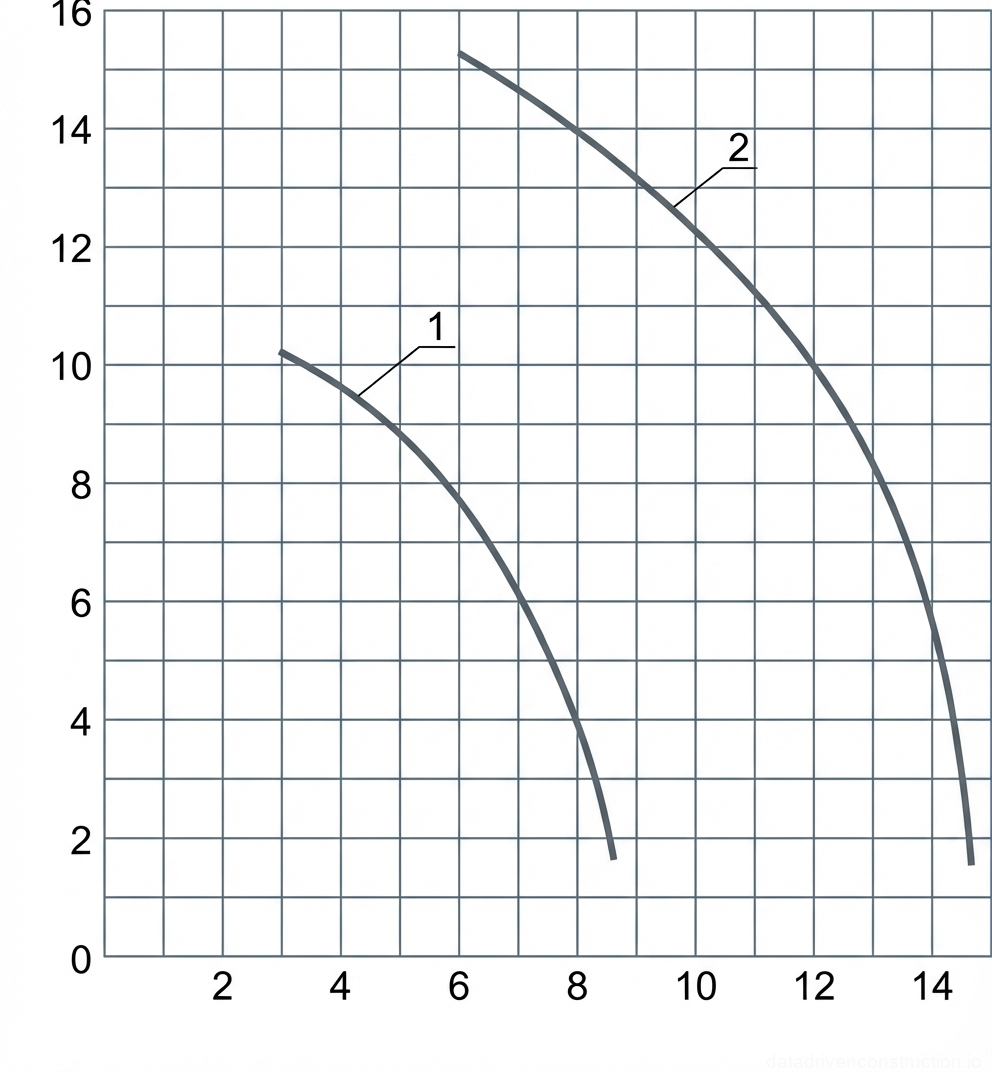
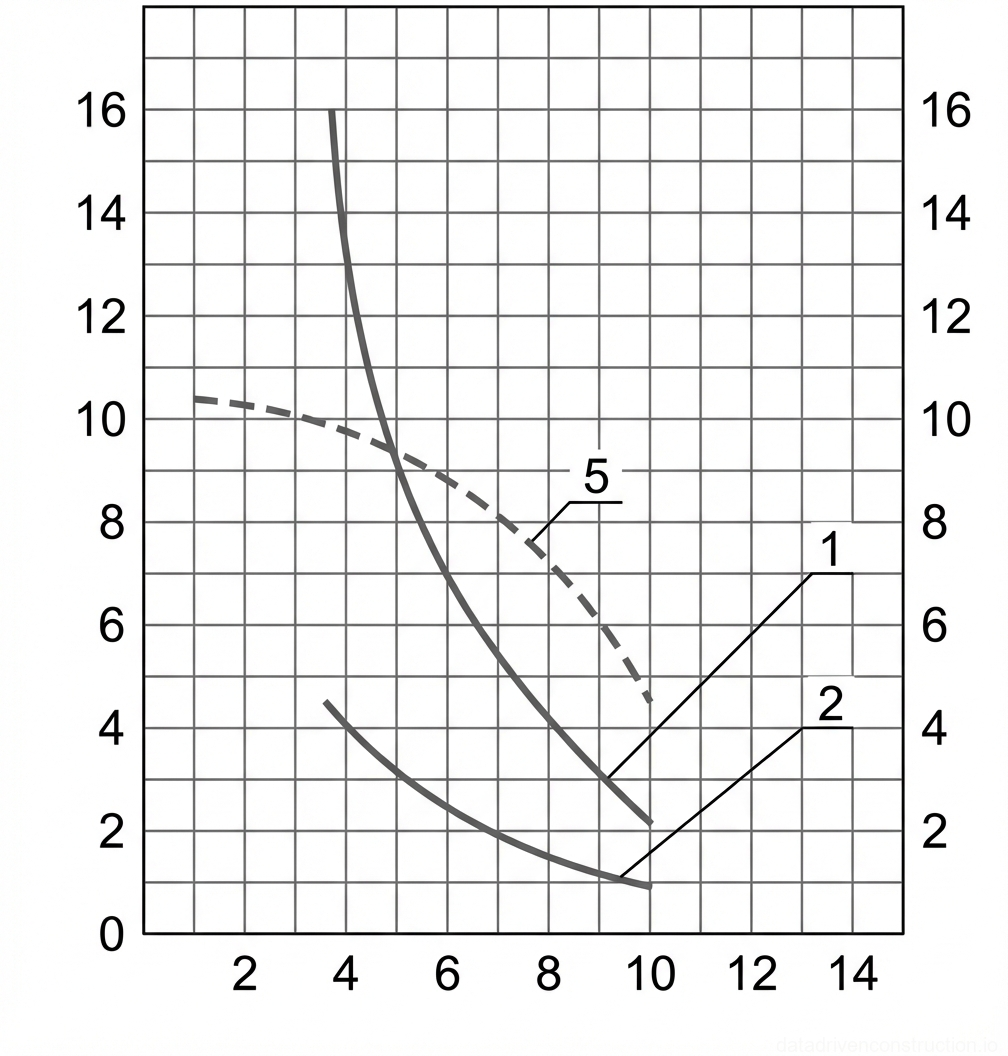
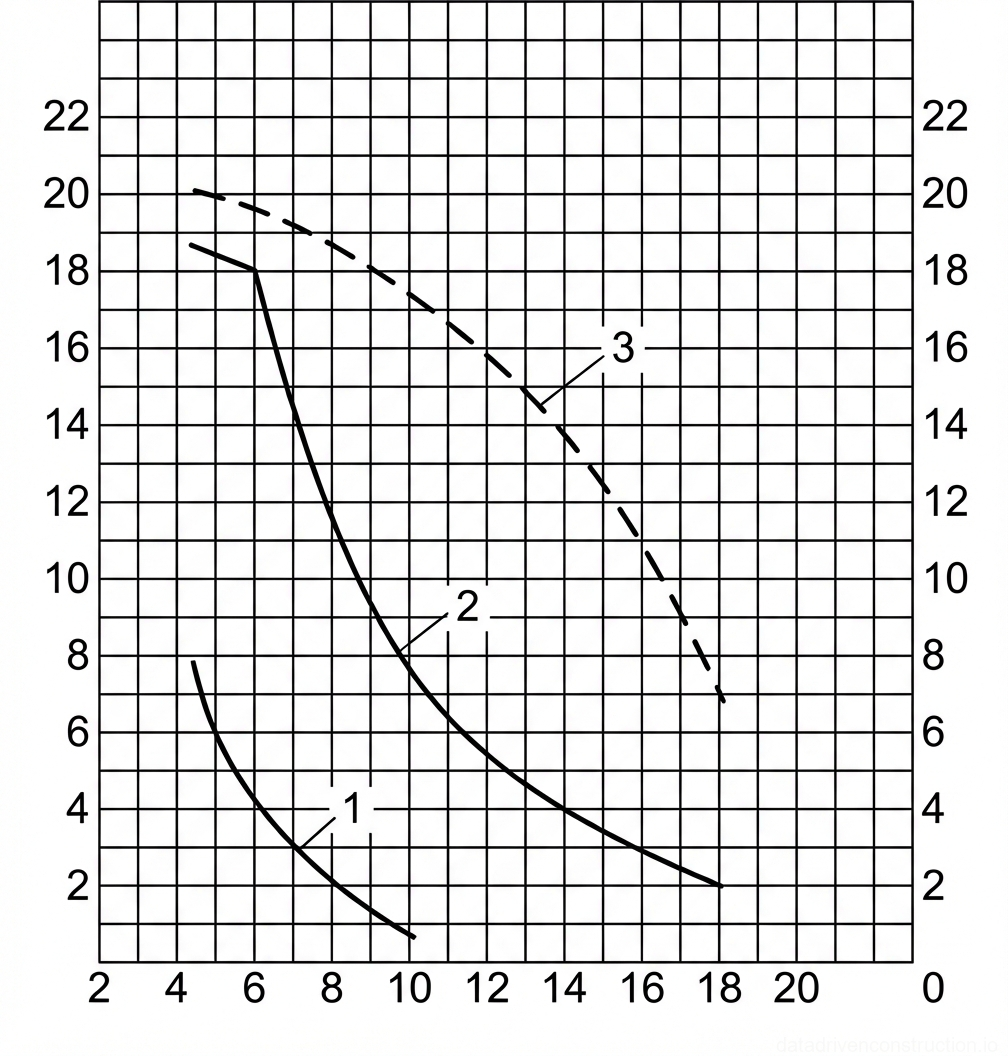
Fig. 10 — Load capacity chart illustrating lifting performance relative to boom reach for two operational configurations
1Load capacity curve for the primary boom configuration, showing maximum lift near 10 tons at 3 meters radius, decreasing to approximately 2 tons at an 8.5-meter radius.
2Load capacity curve for an extended or secondary boom configuration, indicating a maximum lift of over 15 tons at 6 meters, tapering down to roughly 2 tons at a 14.5-meter radius.
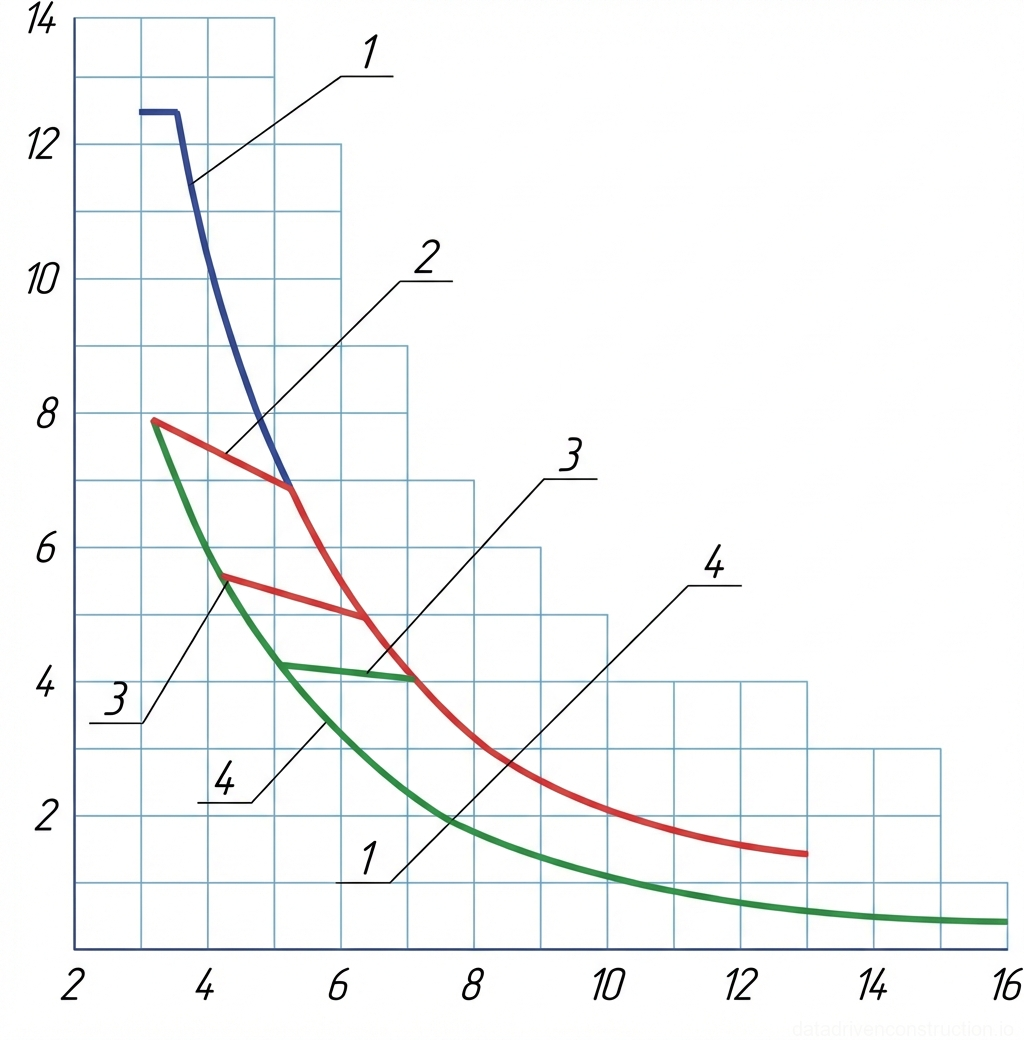
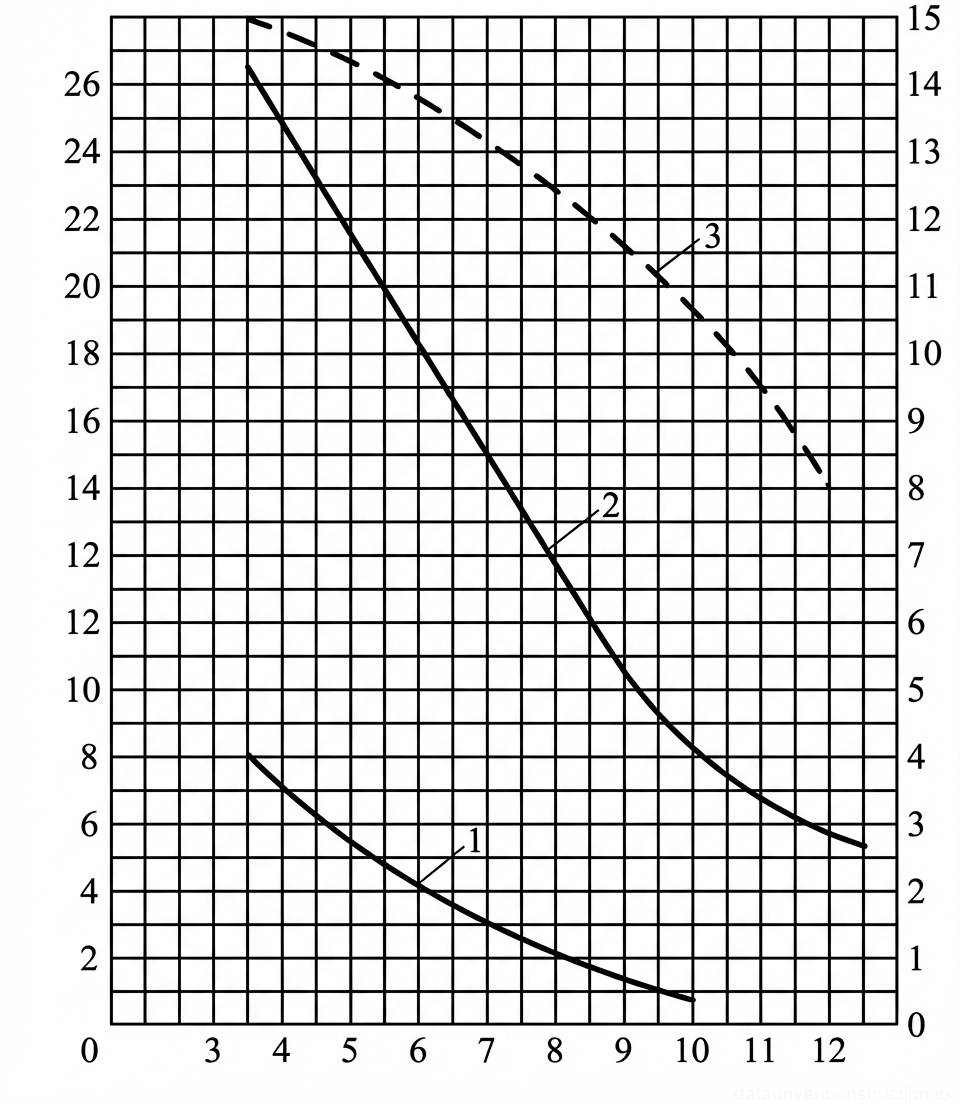
Fig. 11 — Crane load-lifting capacity chart indicating capacity versus boom reach for various boom lengths
1Load capacity curve for boom length L = 8 m, showing maximum lifting capacity at various reaches
2Load capacity curve for boom length L = 10 m, indicating reduced capacity at extended reaches compared to shorter booms
3Load capacity curve for boom length L = 12 m, illustrating further reduction in lifting capacity as boom length increases
4Load capacity curve for boom length L = 14 m, representing the lowest lifting capacities for the longest boom configuration
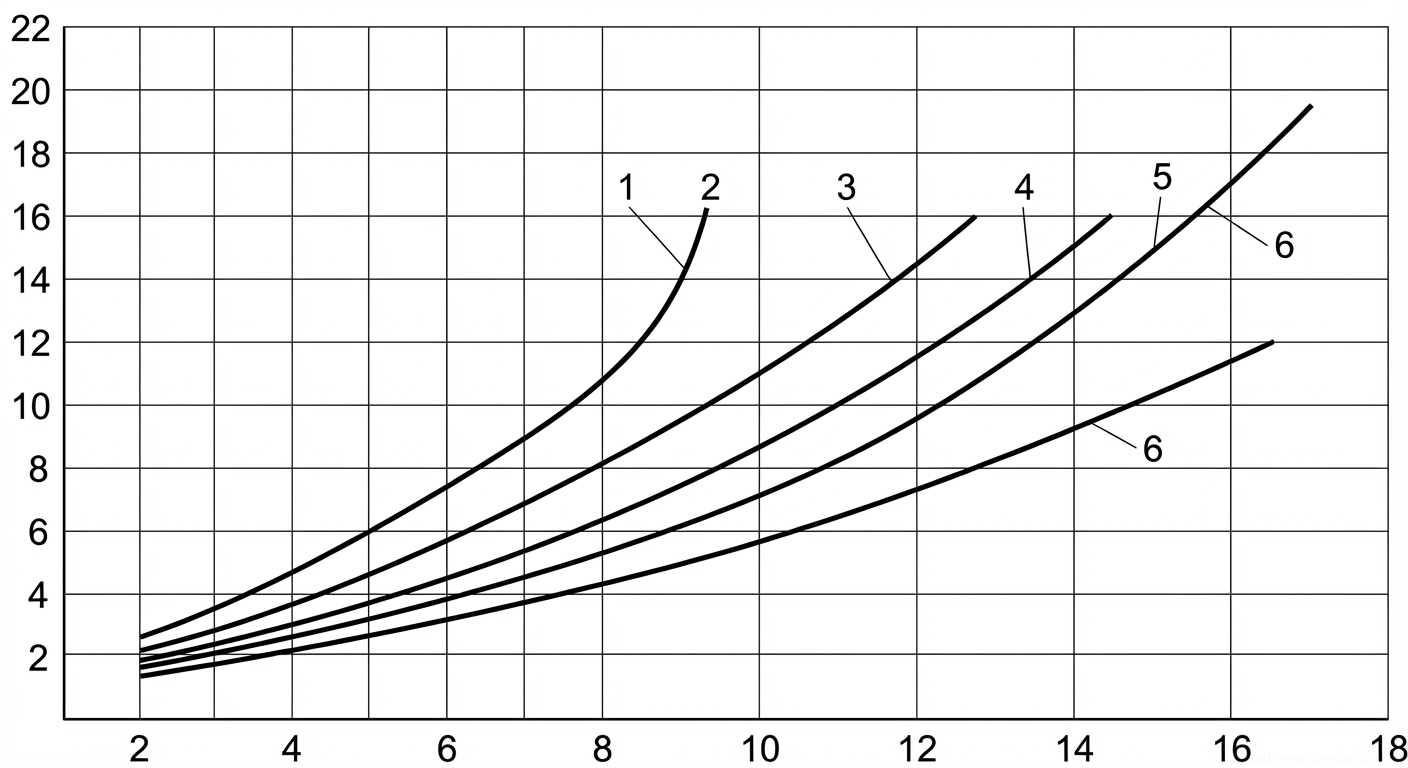
Fig. 12 — Graph of hook lifting height versus boom reach for various boom configurations
1Curve indicating lifting characteristics for the shortest boom length configuration
2Curve indicating lifting characteristics for the second shortest boom length configuration
3Curve indicating lifting characteristics for a medium boom length configuration
4Curve indicating lifting characteristics for an intermediate boom length configuration
5Curve indicating lifting characteristics for the second longest boom length configuration
6Curve indicating lifting characteristics for the longest boom length configuration, shown in two parts due to possible extension or jib addition
Fig. 13 — Load Chart Indicating Crane Lifting Capacity and Hook Height Relative to Boom Reach
1Solid curve representing the lifting capacity (in tons) relative to the boom reach (in meters) for a specific operational configuration or boom length.
2Solid curve representing the lifting capacity (in tons) relative to the boom reach (in meters) for an alternative operational configuration or boom length.
5Dashed curve indicating the hook lifting height (in meters) corresponding to the boom reach.
Fig. 14 — Load chart and hook lifting height curves for a jib crane, detailing lifting capacities and heights with main and extended boom configurations, with and without outrigger support.
1Load capacity curve for the main boom when operating on outriggers, showing maximum lifting capacity relative to outreach.
2Load capacity curve for the main boom when operating without outriggers, indicating reduced capacity due to lack of stabilization.
3Load capacity curve for the main boom equipped with an intermediate section (extension), operating on outriggers.
4Load capacity curve for the main boom equipped with an intermediate section (extension), operating without outriggers.
5Hook lifting height curve for the main boom, representing the maximum achievable height at various outreach distances.
6Hook lifting height curve for the main boom equipped with an intermediate section (extension), showing increased lifting height capabilities.
7Vertical axis representing the load-lifting capacity of the crane, measured in metric tons (t).
8Horizontal axis representing the boom outreach (radius), measured in meters (m) from the crane's center of rotation.
9Vertical axis representing the hook lifting height, measured in meters (m) from ground level.
Fig. 15 — Crane Load Chart: Lifting Capacity and Hook Height vs. Boom Outreach
1Main boom lifting capacity curve, illustrating the maximum allowable load for a specific boom configuration across varying outreach distances.
2Secondary lifting capacity curve, potentially representing an extended boom or jib configuration, showing reduced capacity at extended ranges.
3Intermediate lifting capacity curve, indicating load limits for an alternate intermediate boom length.
4Minimum hook height limit line, showing the lowest operational height at maximum extension for a specific configuration.
5Hook height curve corresponding to configuration 1, demonstrating the achievable lifting height (dashed line) relative to outreach.
6Hook height curve corresponding to an extended or secondary configuration, showing increased lifting height capabilities.
Fig. 16 — Crane load chart detailing lifting capacity and hook height as a function of jib radius
3Lifting capacity curve for minimum jib length (solid line), indicating maximum safe load at varying radii
4Lifting capacity curve for maximum jib length (solid line), showing reduced load limits at extended radii
5Hook height curve for maximum jib length (dashed line), illustrating maximum vertical reach at different radii
6Hook height curve for minimum jib length (dashed line), detailing vertical reach limitations at shorter radii
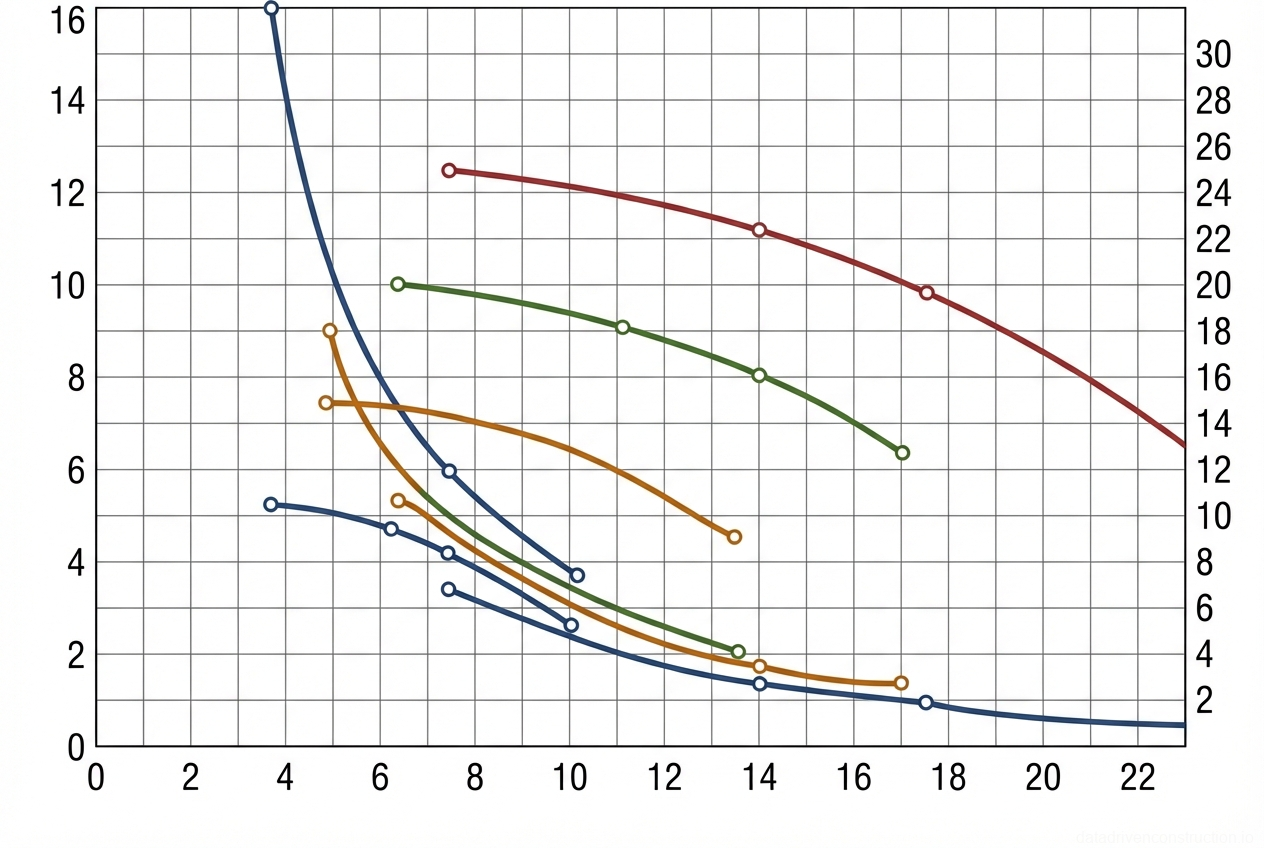
Fig. 17 — Crane load chart showing capacity and lifting height curves against boom radius
1Load capacity curve for secondary hook/configuration (Грузоподъемность), showing values decreasing from approximately 4 tons at 4m radius to 1 ton at 10m radius
2Lifting height curve (Высота подъема крюка), illustrating the maximum hook height decreasing from over 16m at minimal radius to approximately 3m at 10m radius
3Load capacity curve for main hook/configuration (Грузоподъемность), showing higher capacities, e.g., decreasing from 10 tons at ~5m radius to lower values at extended radii
Fig. 18 — Load-lifting capacity and hook height diagram for a mobile crane as a function of boom radius
1Curve indicating the crane's lifting capacity (in tons) when operating without the use of outriggers (on wheels), showing a significant decrease in capacity as the boom radius increases.
2Curve representing the enhanced lifting capacity (in tons) when the crane is stabilized using outriggers, allowing for heavier loads at corresponding boom radii compared to operation without outriggers.
3Dashed curve illustrating the maximum achievable height of hook lift (in meters) relative to the boom radius, demonstrating how lift height decreases as the boom is extended outward.
Fig. 19 — Load and height characteristic curves for a crane as a function of boom outreach
1Solid curve representing lifting height (meters) vs. boom outreach (meters), indicating the maximum vertical reach of the hook at a given radius.
2Dashed curve representing the lifting height (meters) vs. boom outreach (meters) under a specific operational configuration or secondary mode.
3Solid curves representing lifting capacity (tons) vs. boom outreach (meters), showing the maximum safe working load at various working radii, likely for different boom lengths or configurations.
Fig. 20 — Typical load chart (capacity and lifting height curves) for a construction crane illustrating the relationship between boom outreach, lifting capacity, and hook height.
1Horizontal axis (X-axis) representing the boom outreach or operating radius, measured in meters (m)
2Primary vertical axis (left Y-axis) indicating the crane's lifting capacity or safe working load, measured in metric tons (t)
3Secondary vertical axis (right Y-axis) denoting the maximum hook lifting height, measured in meters (m)
4Load capacity curve (solid line) illustrating the maximum allowable load as an inversely proportional function of the boom outreach
5Lifting height curve (dashed line) showing the maximum vertical reach of the crane hook corresponding to various operating radii
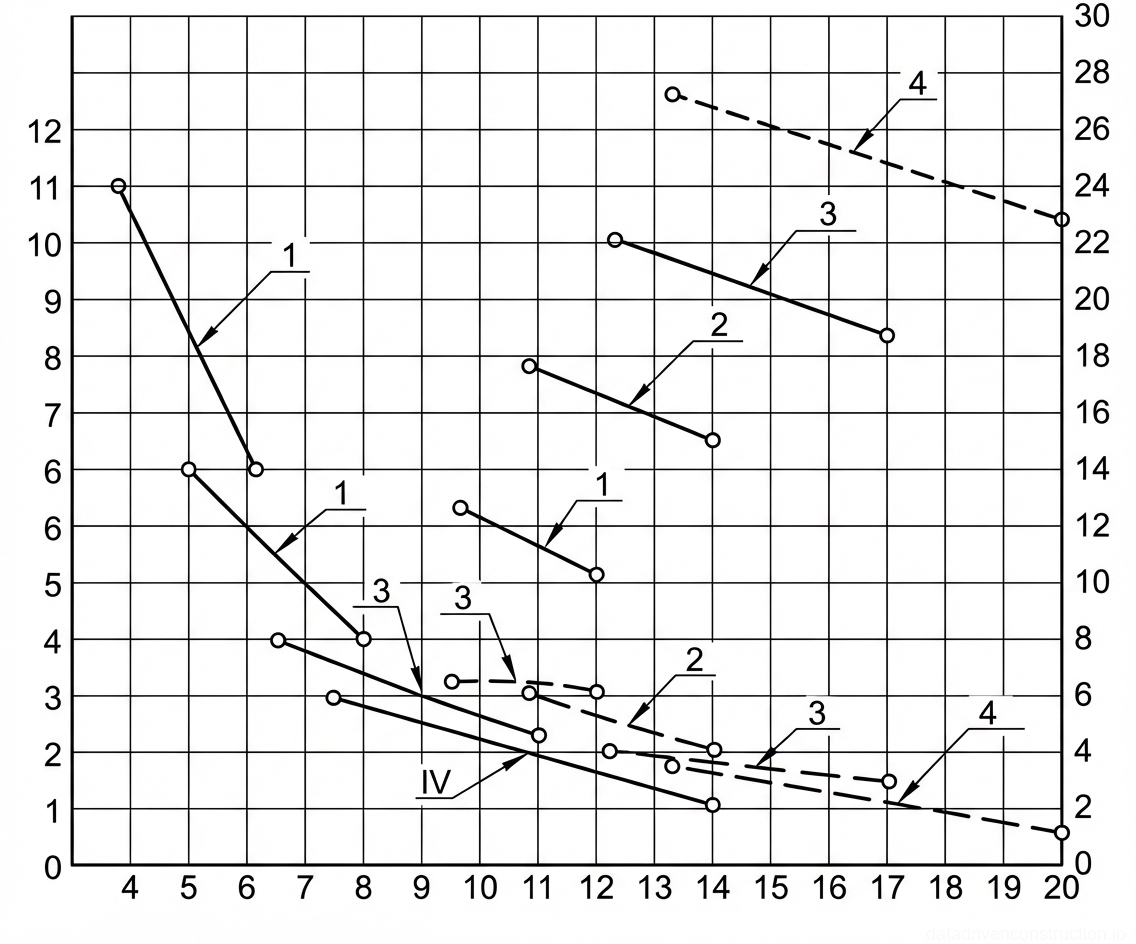
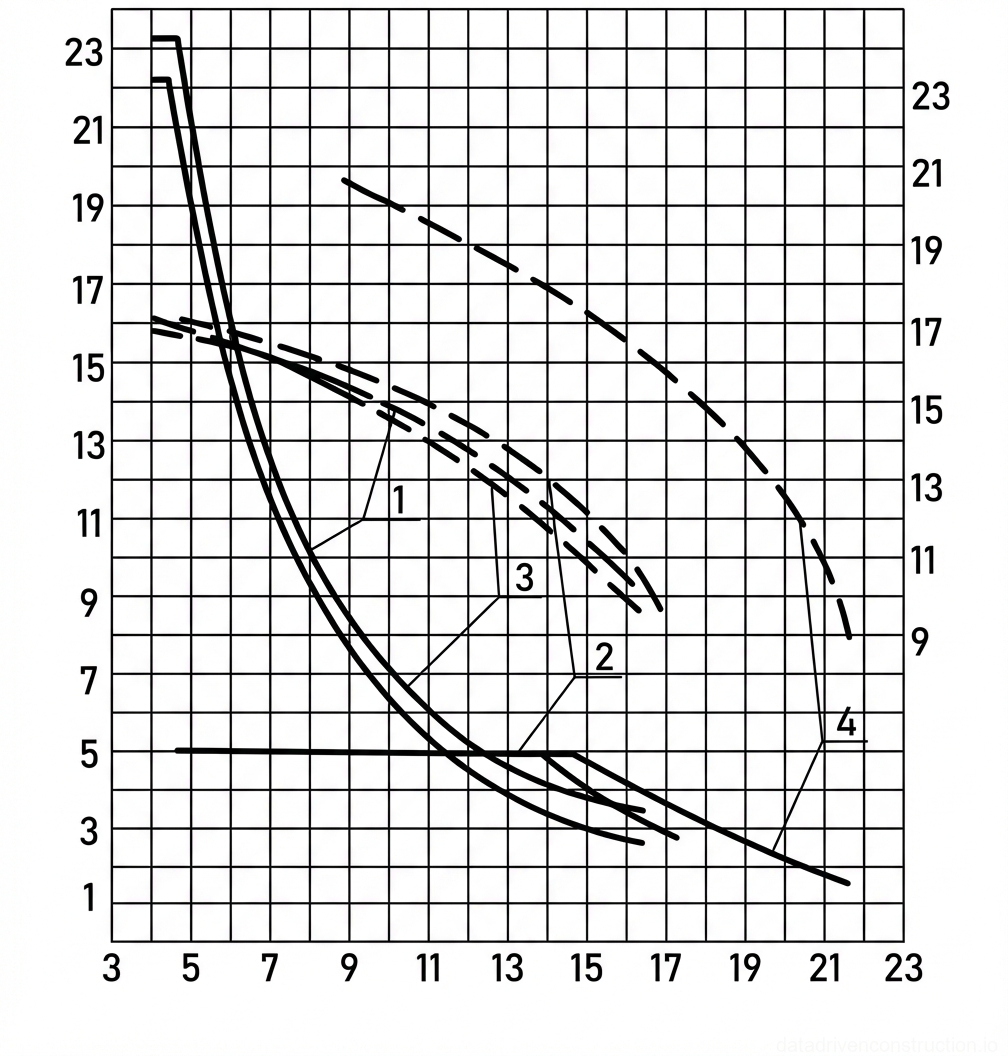
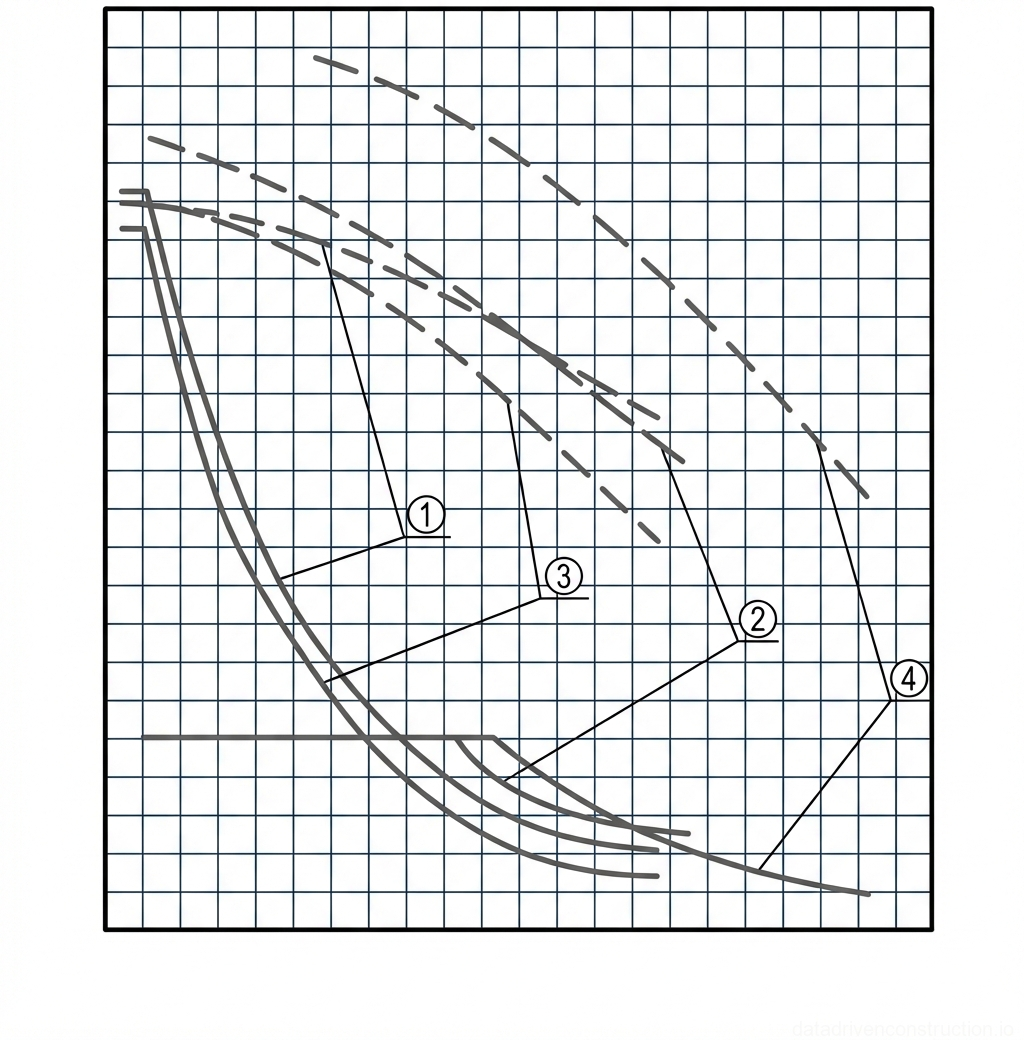
Fig. 21 — Crane load chart illustrating the relationship between boom reach and hook lifting height across various configurations
1Solid curve representing load capacity or lifting height parameter for configuration IV
2Solid curve representing load capacity or lifting height parameter for configuration III
3Solid curve representing load capacity or lifting height parameter for configuration II
4Solid curve representing load capacity or lifting height parameter for configuration I
5Primary solid curve representing the main load capacity parameter for configuration I
6Dashed curve representing an operational parameter, likely maximum lifting height, for configuration II
7Dashed curve representing an operational parameter, likely maximum lifting height, for configuration III
8Dashed curve representing an operational parameter, likely maximum lifting height, for configuration IV
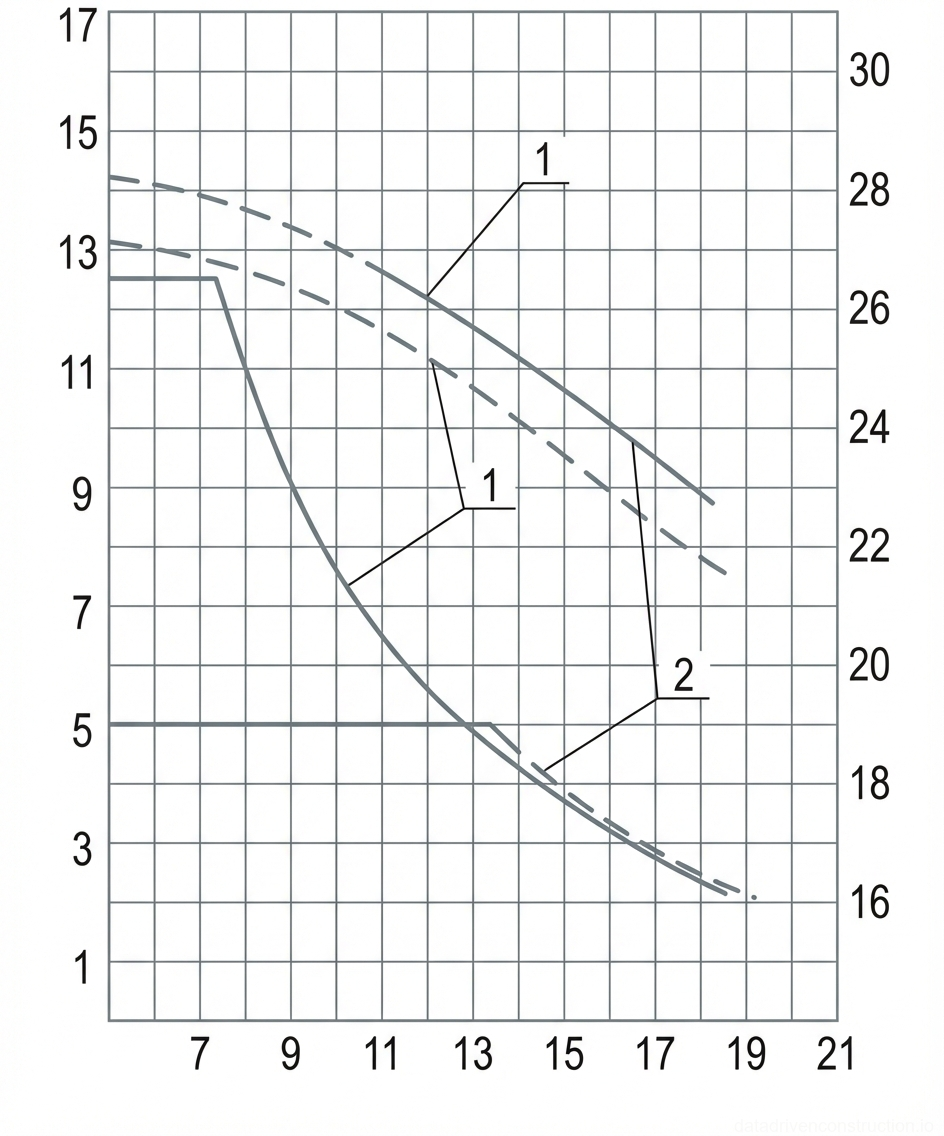
Fig. 22 — Crane Load Chart: Lifting Capacity and Hook Height vs. Boom Reach
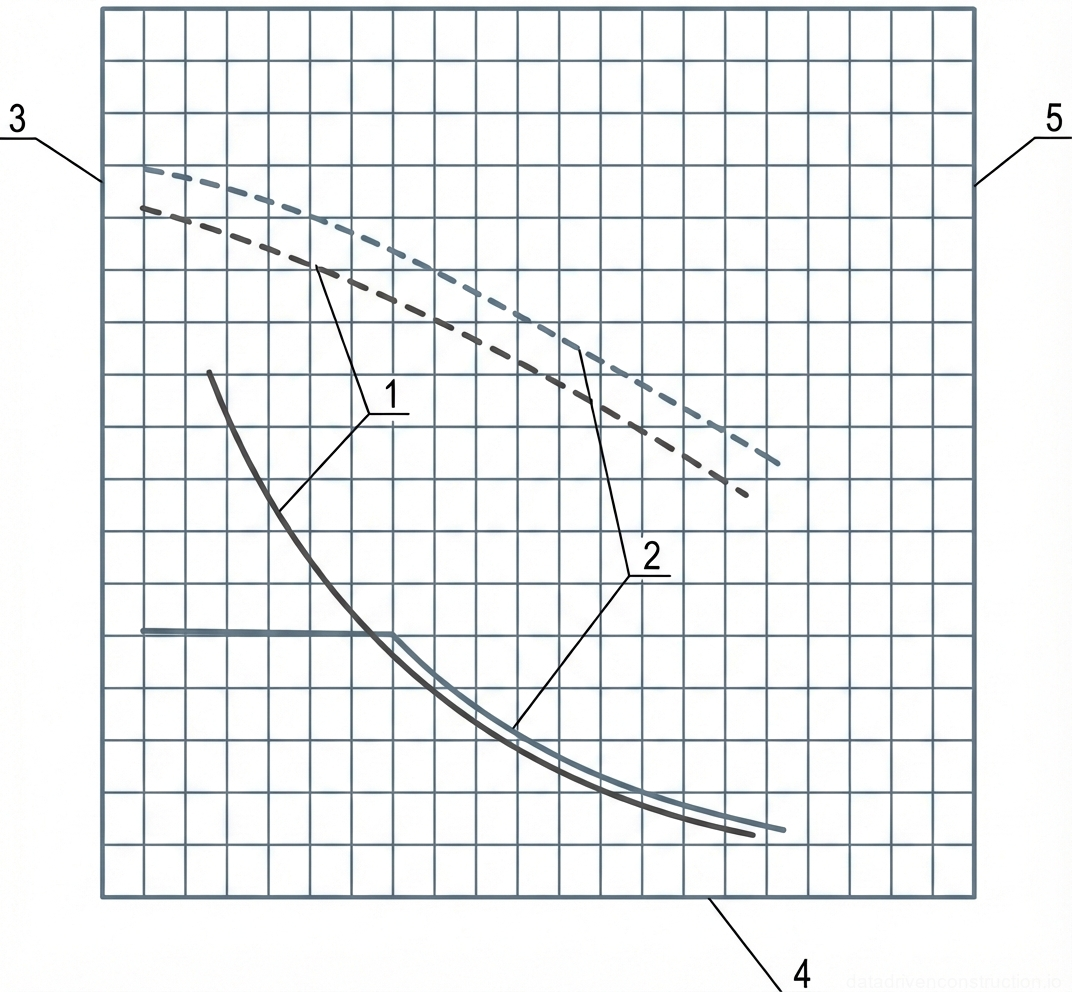
Fig. 23 — Crane load chart detailing lifting capacity and height as a function of boom outreach for multiple boom configurations
1Performance curve representing boom configuration I, showing load capacity and lifting height relative to outreach
2Performance curve representing boom configuration II, detailing changes in load capacity and lifting height with increasing outreach
3Performance curve representing boom configuration III, illustrating the relationship between outreach, load capacity, and lifting height
4Performance curve representing boom configuration IV, indicating maximum outreach limits and corresponding load capacities and lifting heights
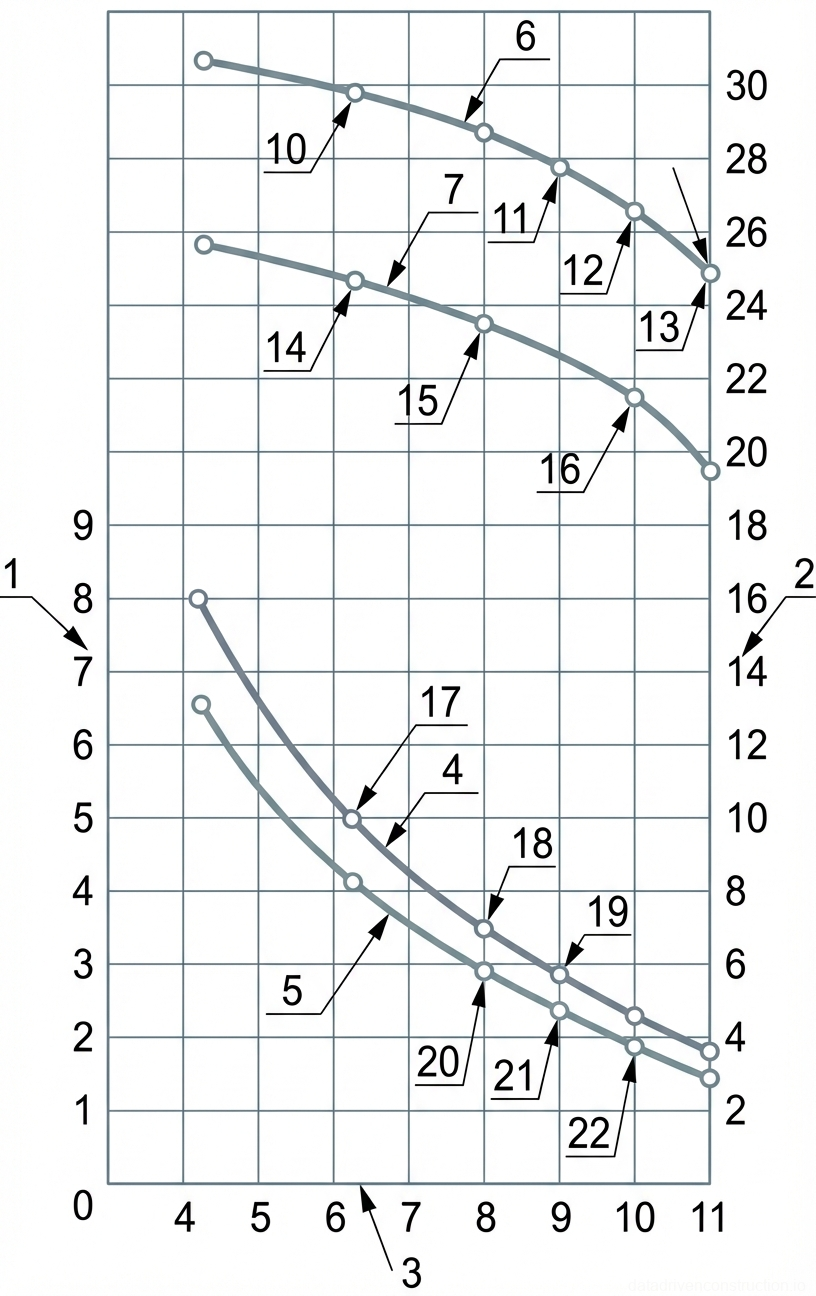
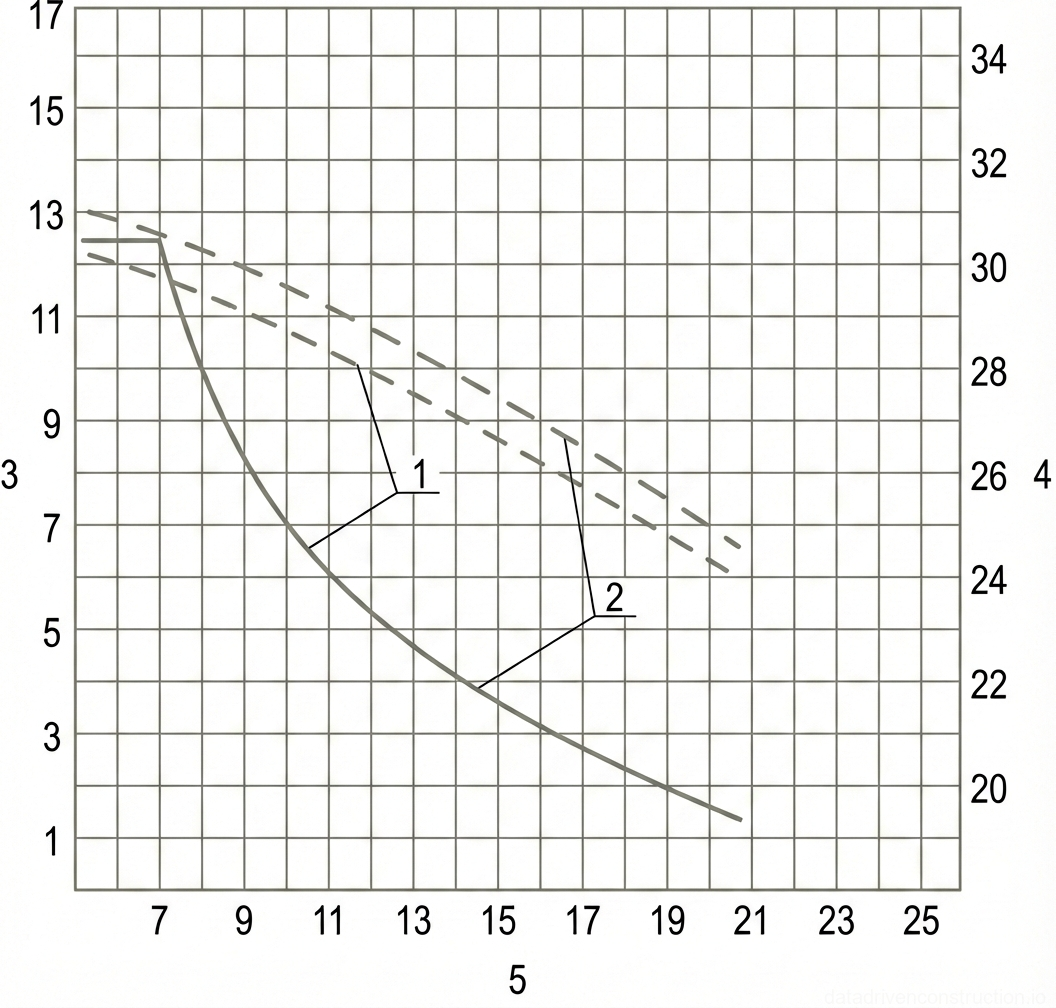
Fig. 24 — Load-lifting characteristic chart of a crane showing load capacity and hook lifting height relative to boom reach
1Left vertical axis — Load capacity (Грузоподъемность), measured in metric tons (т), scaling from 0 to 9.
2Right vertical axis — Hook lifting height (Высота подъема крюка), measured in meters (м), scaling from 2 to 30.
3Horizontal axis — Boom reach (Вылет стрелы), measured in meters (м), scaling from 4 to 11.
4Upper load capacity curve (Curve I) — Indicates the maximum safe lifting load in tons for a specific crane configuration across different boom reaches.
5Lower load capacity curve (Curve II) — Indicates the maximum safe lifting load in tons for an alternative crane configuration or condition across different boom reaches.
6Upper hook lifting height curve (Curve II) — Shows the maximum attainable hook height in meters corresponding to the boom configuration of Curve II across various reaches.
7Lower hook lifting height curve (Curve I) — Shows the maximum attainable hook height in meters corresponding to the boom configuration of Curve I across various reaches.
10Data point on upper hook height curve — Represents a specific lifting height (approx. 29.5m) at a boom reach of 6m.
11Data point on upper hook height curve — Represents a specific lifting height (approx. 27.5m) at a boom reach of 9m.
12Data point on upper hook height curve — Represents a specific lifting height (approx. 26m) at a boom reach of 10m.
13Data point on upper hook height curve — Represents a specific lifting height (approx. 24.5m) at a boom reach of 11m.
14Data point on lower hook height curve — Represents a specific lifting height (approx. 24.5m) at a boom reach of 6m.
15Data point on lower hook height curve — Represents a specific lifting height (approx. 23.5m) at a boom reach of 8m.
16Data point on lower hook height curve — Represents a specific lifting height (approx. 21m) at a boom reach of 10m.
17Data point on upper load capacity curve — Represents a safe load capacity of 5.0 tons at a boom reach of 6m.
18Data point on upper load capacity curve — Represents a safe load capacity of approx. 3.5 tons at a boom reach of 8m.
19Data point on upper load capacity curve — Represents a safe load capacity of approx. 2.9 tons at a boom reach of 9m.
20Data point on lower load capacity curve — Represents a safe load capacity of 3.0 tons at a boom reach of 8m.
21Data point on lower load capacity curve — Represents a safe load capacity of approx. 2.4 tons at a boom reach of 9m.
22Data point on lower load capacity curve — Represents a safe load capacity of approx. 1.9 tons at a boom reach of 10m.
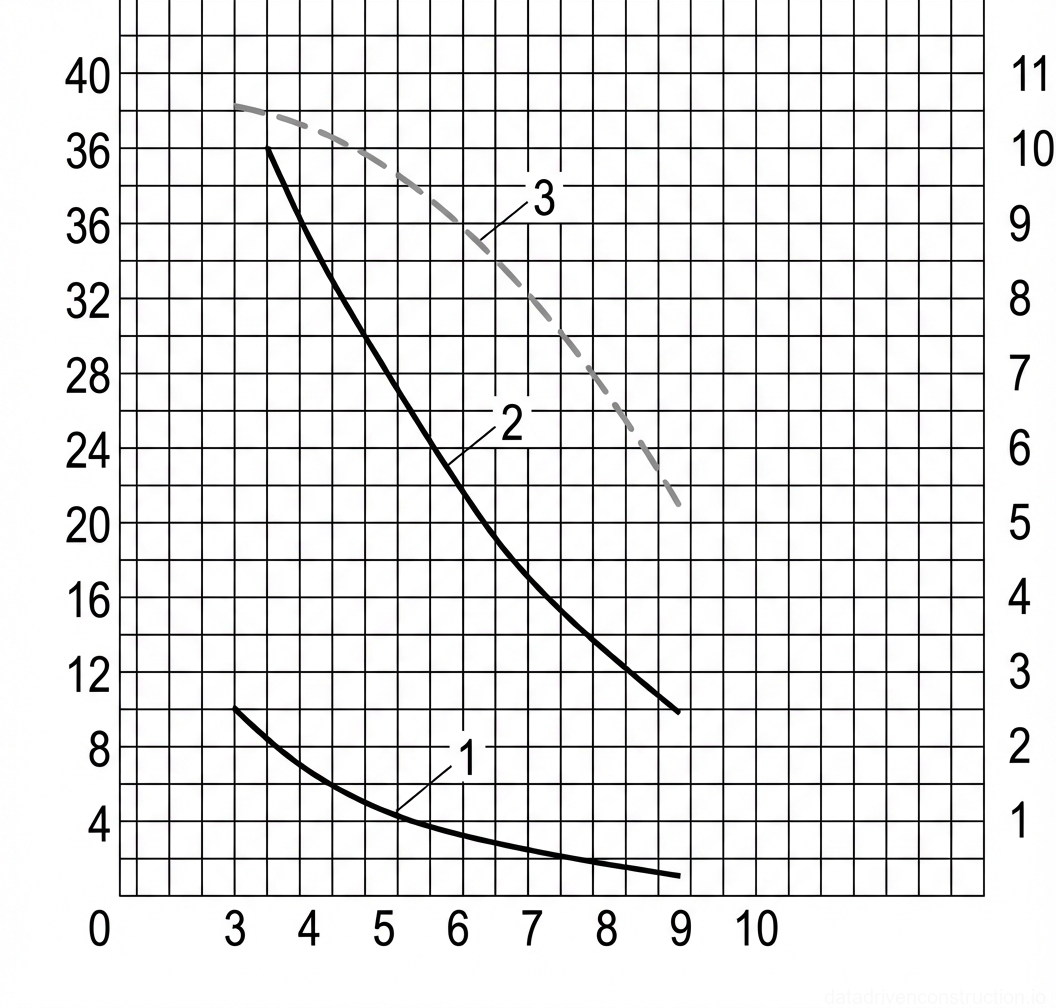
Fig. 25 — Crane load chart detailing lifting capacity and hook height as a function of boom outreach
1Curve representing the lifting capacity at minimum boom length (or specific configuration), showing a decrease from approximately 10 tons at 3m outreach to roughly 1 ton at 9m outreach
2Curve representing the lifting capacity at maximum boom length (or specific configuration), showing a decrease from approximately 40 tons at 3.5m outreach to 10 tons at 9m outreach
3Dashed curve representing the hook lifting height (in meters) corresponding to the boom outreach, indicating how the maximum lifting height varies with the working radius
Fig. 26 — Load capacity and lifting height charts as a function of boom outreach for crane operations
1Lower lifting capacity curve (solid line), indicating crane load capacity (in tons, left axis) for specific boom outreach values (in meters, bottom axis)
2Upper lifting capacity curve (solid line), showing a higher crane load capacity profile (in tons, left axis) relative to boom outreach (in meters, bottom axis), likely for a different boom configuration
3Lifting height curve (dashed line), representing the maximum hook lifting height (in meters, right axis) as a function of boom outreach (in meters, bottom axis)
Fig. 27 — Crane Load and Hook Height Chart showing lifting capacity and hook lifting height versus boom outreach
1Solid curve representing the lower lifting capacity (in tons) as a function of the boom outreach (in meters), likely for a specific crane configuration such as operating without outriggers or with a longer boom extension.
2Solid curve representing the higher lifting capacity (in tons) as a function of the boom outreach (in meters), likely indicating the crane's performance under optimal conditions, such as with fully deployed outriggers or a shorter main boom.
3Dashed curve representing the hook lifting height (in meters) corresponding to the boom outreach, read against the secondary vertical axis on the right side of the chart.
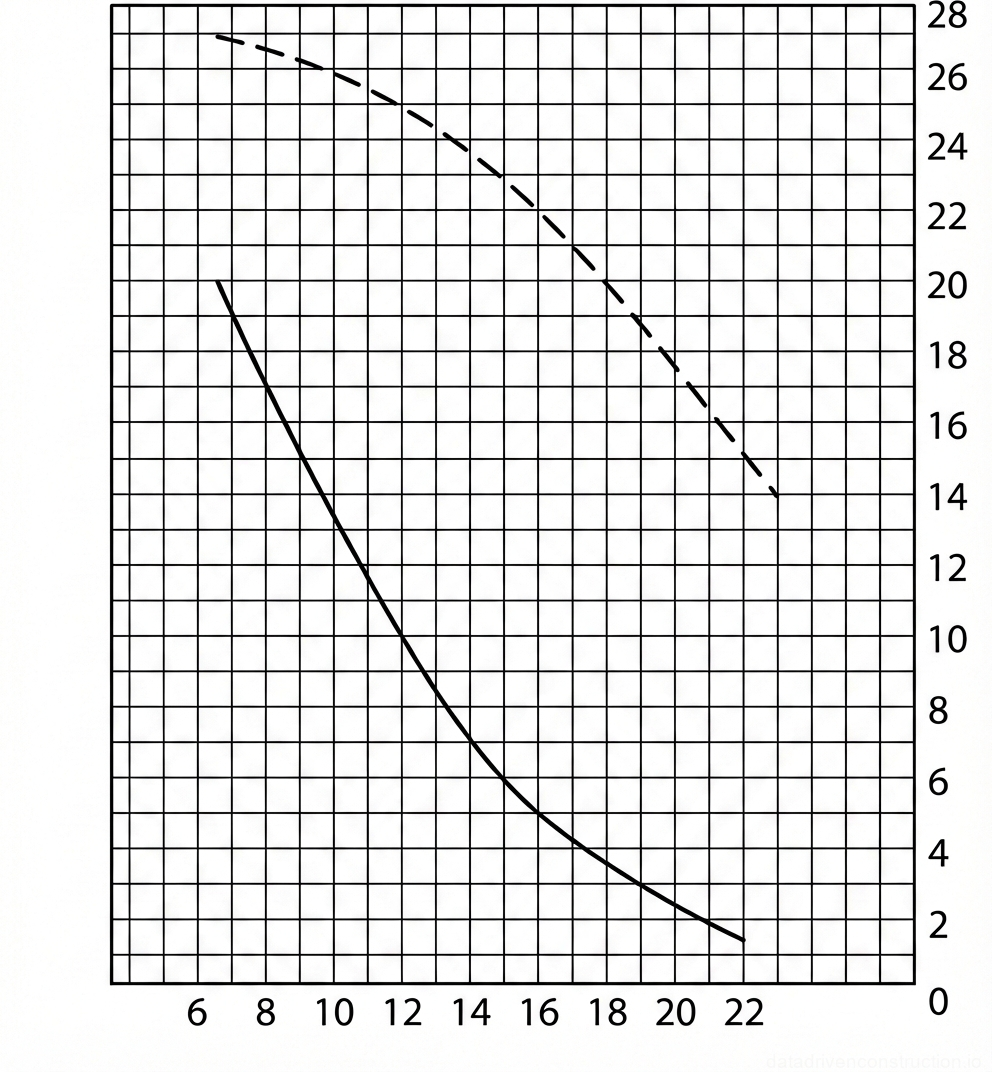
Fig. 28 — Load capacity and hook lifting height chart relative to boom outreach.
Fig. 29 — Crane load chart depicting lifting capacity and hook height as a function of boom outreach
1Solid curve representing the primary lifting capacity (Грузоподъемность) in metric tons (t) as a function of boom outreach (Вылет стрелы) in meters (m) for the main operating configuration.
2Solid curve representing the secondary lifting capacity (Грузоподъемность) in metric tons (t) as a function of boom outreach (Вылет стрелы) in meters (m) for an alternative operating configuration or extended boom.
3Dashed curve representing the hook lifting height (Высота подъема крюка) in meters (m) corresponding to the primary lifting capacity curve (1) as a function of boom outreach.
4Dashed curve representing the hook lifting height (Высота подъема крюка) in meters (m) corresponding to the secondary lifting capacity curve (2) as a function of boom outreach.
Fig. 30 — Crane load and lifting height chart as a function of boom reach
1Solid line representing the load capacity curve (in tons) for the main boom configuration across its full reach range.
3Solid line representing the load capacity curve (in tons) for a secondary or shorter boom configuration.
4Solid line representing the load capacity curve (in tons) for another specific boom configuration or operating mode.
5Dashed line representing the hook lifting height (in meters) corresponding to the boom configuration of curve 3.
6Dashed line representing the hook lifting height (in meters) corresponding to the boom configuration of curve 4.
12Dashed line representing the hook lifting height (in meters) corresponding to the main boom configuration (curve 1).
Fig. 31 — Crane load-lifting and height characteristics chart as a function of boom outreach
1Load capacity curve for the main boom configuration, indicating maximum allowable load at specific out-reaches.
2Load capacity curve for a secondary boom configuration or extension, showing reduced capacity compared to the main boom.
3Point indicating a specific operational limit or transition in the lifting characteristics, possibly related to a specific boom angle or extension.
4Curve or segment representing load capacity under specific conditions, potentially related to a jib or other attachment.
5Dashed curve indicating the hook lifting height corresponding to the main load capacity curve (element 1).
6Dashed curve indicating the hook lifting height for the secondary boom configuration (element 2).
7Dashed line segment representing lifting height for a specific boom extension or operational mode.
8Dashed curve indicating maximum hook lifting height for a specific boom configuration, showing the relationship between height and outreach.
9Solid line segment representing a constant load capacity limit over a range of out-reaches, typical for structural limits before stability becomes the governing factor.
10Solid curve representing the load capacity limit governed by crane stability at larger out-reaches.
Fig. 32 — Crane Load Chart: Lifting Capacity and Height versus Boom Outreach
1Solid curve representing the maximum safe lifting capacity (in tons) for the main boom, plotted against the boom outreach (in meters).
2Solid horizontal line indicating a fixed maximum load capacity, likely representing operations without outriggers or a specific restricted operational mode, up to a certain outreach.
3Dashed curves illustrating the corresponding maximum lifting height (in meters) for the main boom at various outreaches, matching the operational parameters of curve 1.
4Solid curve showing the load capacity for an extended boom or jib configuration, indicating lower lifting capacities at greater outreaches compared to the main boom.
Fig. 33 — Load-lifting and height characteristic curves for a crane with various boom configurations
1Load capacity and lifting height curves for the main boom configuration, indicating maximum lifting capacity at shorter reaches
2Load capacity curve for an extended boom configuration, showing reduced maximum capacity but increased reach
4Maximum extended boom configuration load capacity curve, demonstrating the lowest lifting capacity at the furthest reach
Fig. 34 — Load capacity and hook lifting height chart for a crane based on boom reach
1Main jib configuration showing load capacity (solid line) and hook height (dashed line) curves for standard operation
2Extended jib configuration showing load capacity (solid line) and hook height (dashed line) curves for increased reach
Fig. 35 — Crane load-lifting capacity and hook height performance chart as a function of boom operating radius
1Solid and dashed performance curves representing load capacity and hook lifting height, respectively, for the primary or standard boom configuration.
2Solid and dashed performance curves representing load capacity and hook lifting height, respectively, for an extended boom or jib configuration, providing greater lifting height at a reduced initial load capacity.
3Left-hand vertical axis scale measuring the crane's structural load-lifting capacity in metric tons (t).
4Bottom horizontal axis scale measuring the boom operating radius or functional reach from the crane's rotation center in meters (m).
5Right-hand vertical axis scale measuring the maximum achievable hook lifting height in meters (m).
Fig. 36 — Crane load chart illustrating lifting capacity and hook height as a function of boom radius
1Lifting capacity curves (solid lines) — Indicates the maximum safe load the crane can lift at a specific boom radius, measured in tonnes (left axis).
2Hook height curves (dashed lines) — Shows the maximum attainable height of the crane hook at a corresponding boom radius, measured in meters (right axis).
3Vertical axis (left) — Represents the lifting capacity in tonnes (Грузоподъемность, т), ranging from 1 to 17.
4Vertical axis (right) — Represents the hook lifting height in meters (Высота подъема крюка, м), ranging from 20 to 34.
5Horizontal axis — Denotes the boom radius or reach in meters (Вылет стрелы, м), ranging from 7 to 25.
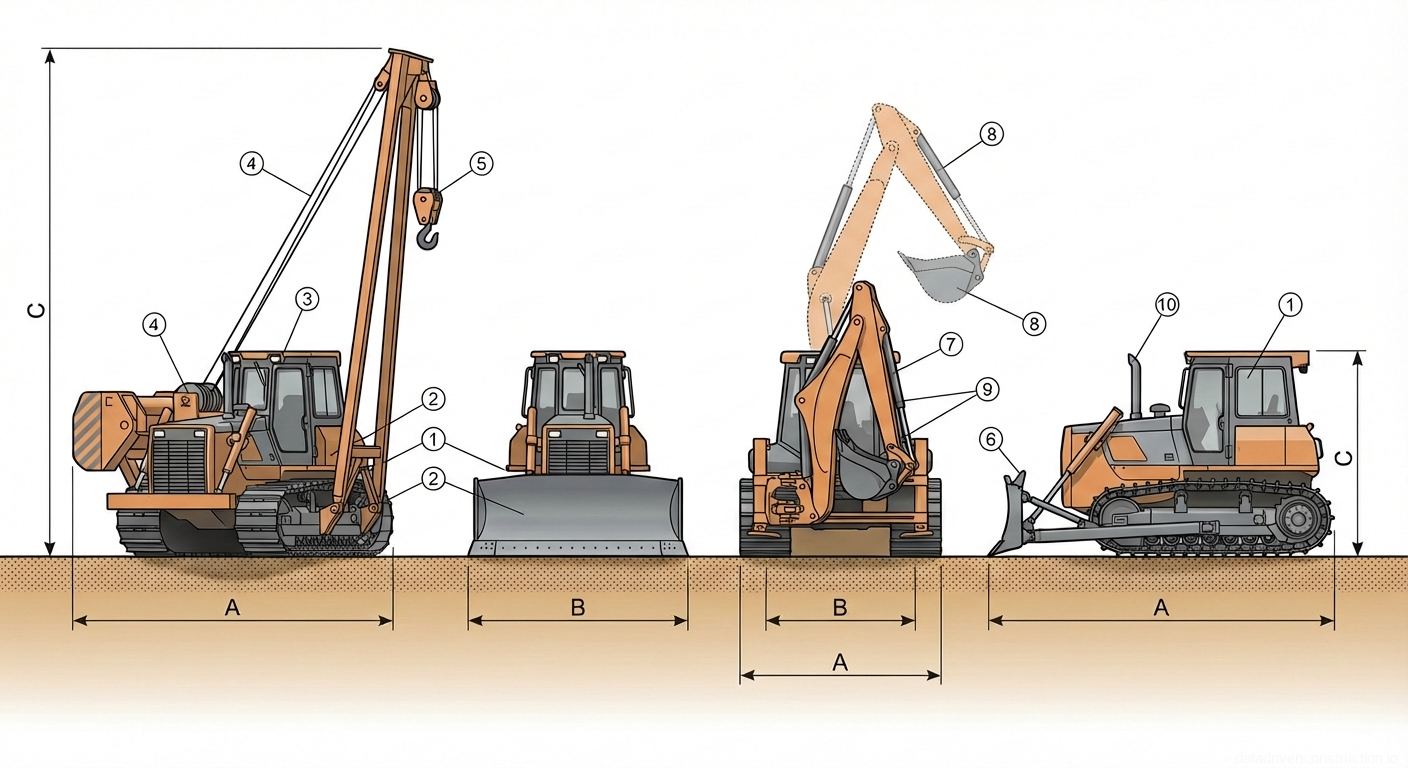
Fig. 37 — Multi-view illustration of crawler-mounted construction machinery configurations including pipelayer, bulldozer, and hydraulic excavator
1Operator cabin (ROPS/FOPS compliant), providing safety, visibility, and ergonomic control interface for the operator
2Heavy-duty crawler undercarriage tracks with grouser pads, ensuring low ground pressure, stability, and high traction on uneven terrain
3Pipelayer A-frame boom structure, constructed of high-strength steel, designed for lifting and positioning heavy pipes
4Wire rope hoisting and luffing rigging system, utilizing multiple sheaves to control boom angle and load elevation
5Heavy-duty lifting block and hook assembly, attached to the hoist rope for secure load attachment during pipelaying operations
6Front-mounted bulldozer blade (straight or semi-U type) with replaceable cutting edges, actuated by hydraulic cylinders for earthmoving and grading
7Hydraulic backhoe boom assembly, providing the primary structural reach for excavation tasks
8Hydraulic backhoe dipper stick (arm) and bucket linkage, extending the digging envelope and controlling the excavation stroke
9Hydraulic cylinders (boom, stick, and bucket), supplying the precise linear force required for articulation of the backhoe attachment
10Engine exhaust stack, routing diesel engine emissions away from the operator cabin and work area
Fig. 38 — Load chart indicating hook lift height and lifting capacity versus boom reach for a crane
1Curve representing the height of hook lift (Высота подъема крюка, м) relative to the boom reach, plotted on the right vertical axis.
2Curve showing the lifting capacity (Грузоподъемность, т) as a function of the boom reach, plotted on the left vertical axis.
Fig. 39 — Load capacity and lifting height chart for crane operation
1Curve indicating the hook lifting height (in meters) relative to the boom radius, showing the vertical reach profile of the equipment.
2Lower lifting capacity curve (in tons), likely representing maximum safe working load limits without outriggers or under specific constrained operational configurations across varying boom radii.
3Upper lifting capacity curve (in tons), representing maximum safe working load limits with full outrigger deployment or optimal structural configuration across the operational radius.
Fig. 40 — Equipment characteristic chart detailing operational load capacities and hook lifting height as functions of boom reach
1Dashed line graphical curve representing the hook lifting height characteristic, mapping the achievable vertical elevation of the hook (read on the right axis, in meters) against the horizontal boom working radius
2Solid lower graphical curve indicating the primary load capacity envelope, defining the maximum safe working load (read on the left axis, in metric tons) safely permissible as the boom reach extends
3Solid upper graphical curve denoting an alternative or enhanced load capacity envelope (e.g., representing a different boom configuration or reeving), showing higher permissible lifting weights (read on the left axis, in metric tons) for a given radius
Fig. 41 — Load chart illustrating lifting capacity and hook height relative to boom reach for crane operations.
1Curve indicating lifting capacity (in tons) relative to boom reach (in meters), showing maximum safe load at varying distances.
2Curve representing hook lifting height (in meters) relative to boom reach (in meters) for an intermediate operational configuration.
3Curve representing hook lifting height (in meters) relative to boom reach (in meters) for a maximum operational configuration.
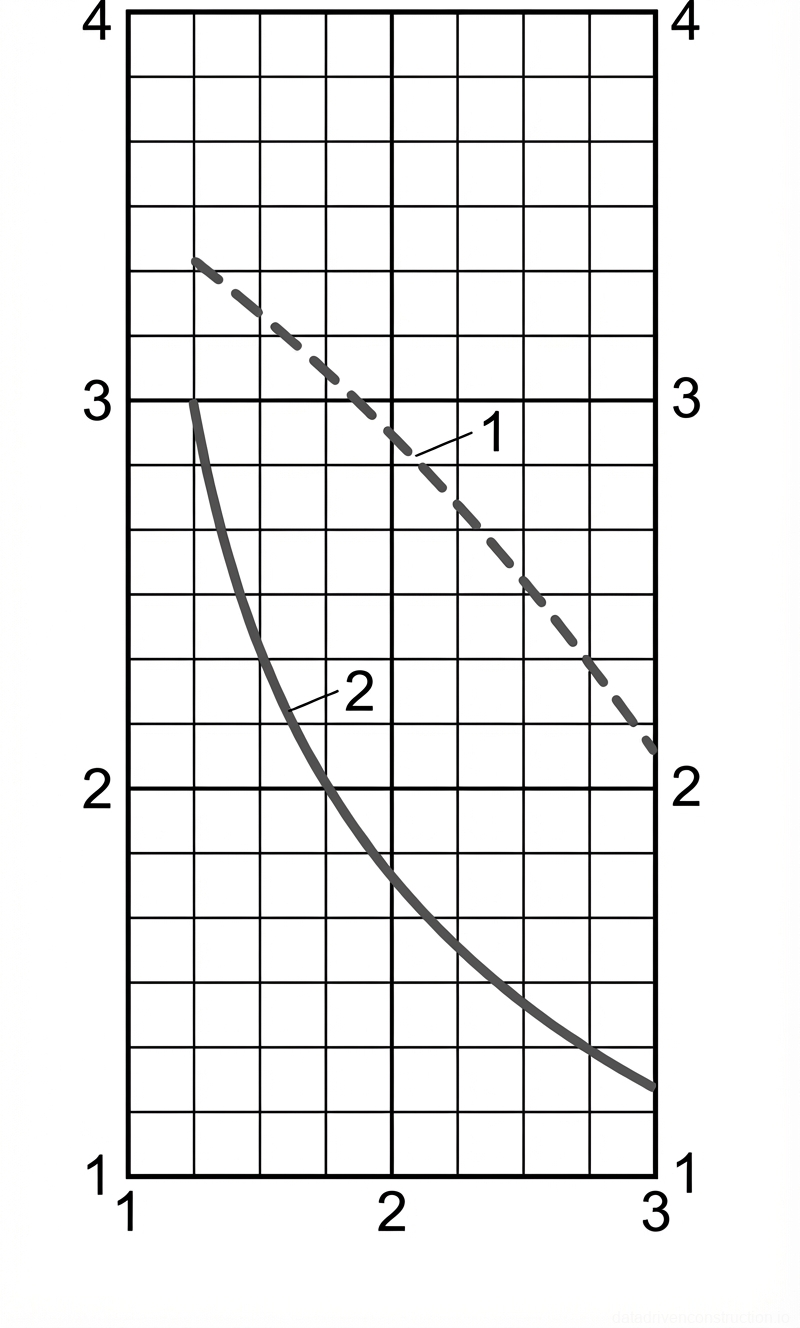
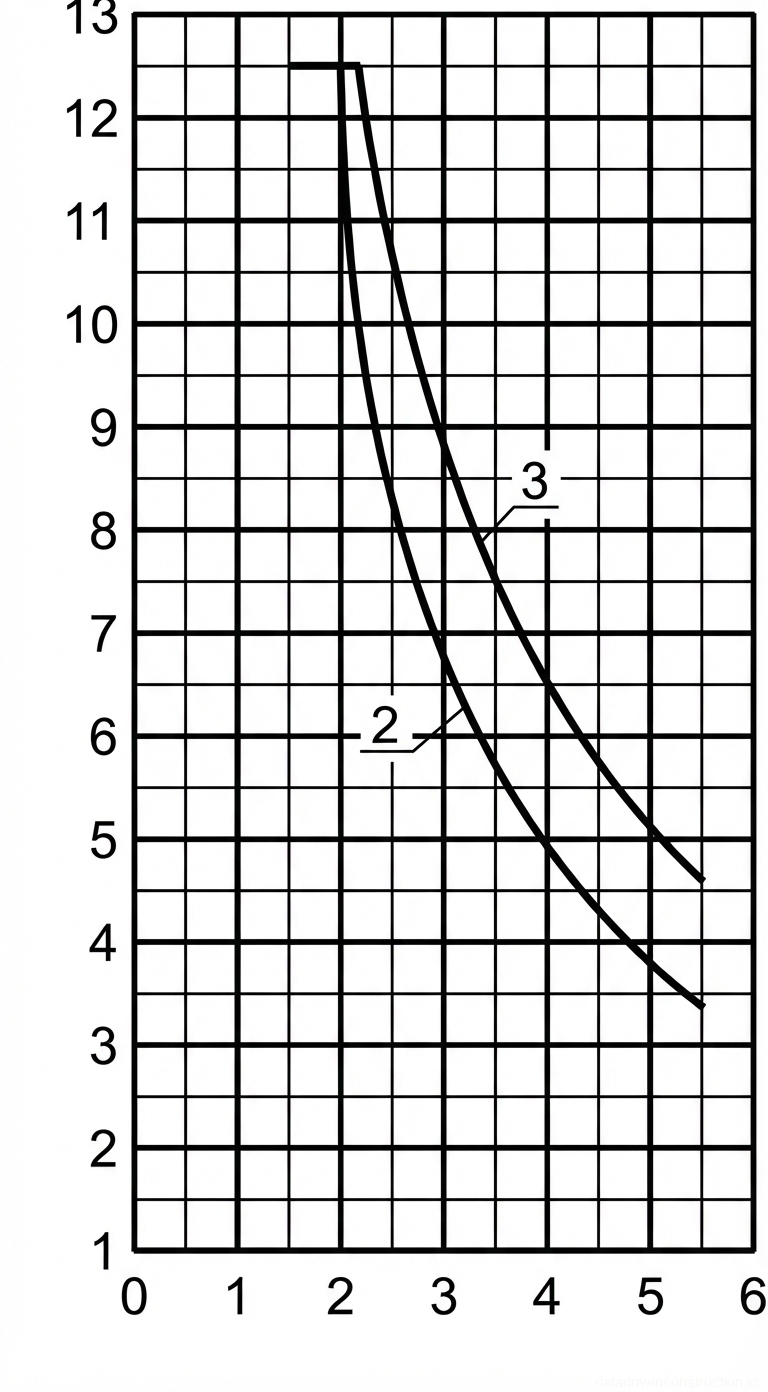
Fig. 42 — Load capacity chart demonstrating the inverse relationship between lifting capacity (tonnes) and boom reach (meters) for two different operational configurations.
2Load capacity curve for configuration 1, showing a steeper decline in lifting capacity as boom reach increases from approximately 2 meters to 5.5 meters.
3Load capacity curve for configuration 2, indicating a higher lifting capacity across the extended boom reach compared to configuration 1, also decreasing from 2.2 meters to 5.5 meters.
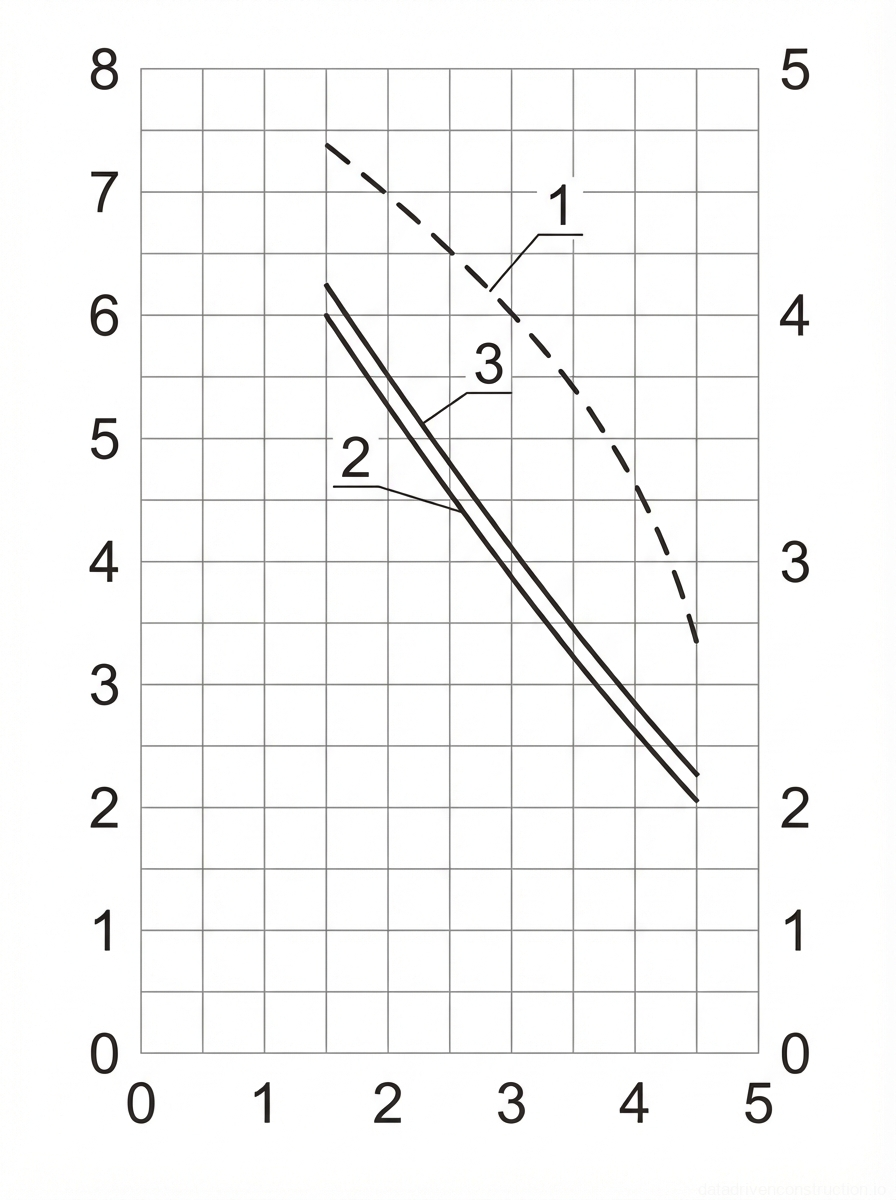
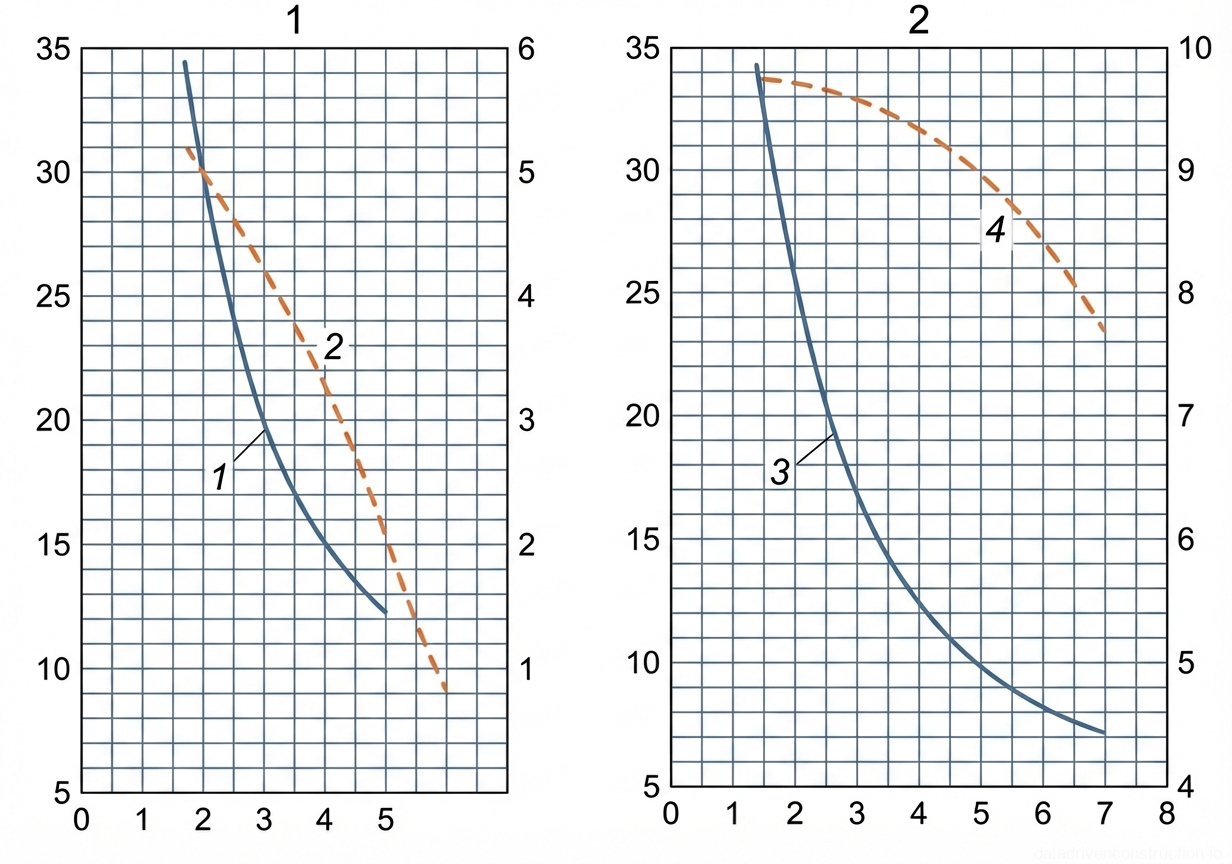
Fig. 43 — Load-lifting characteristics curves of the crawler excavator E-652 with normal and extended boom configurations
1Curve of load-lifting capacity variation depending on the boom reach for the normal boom configuration
2Curve of hook lifting height variation depending on the boom reach for the normal boom configuration
3Curve of load-lifting capacity variation depending on the boom reach for the extended boom configuration
4Curve of hook lifting height variation depending on the boom reach for the extended boom configuration
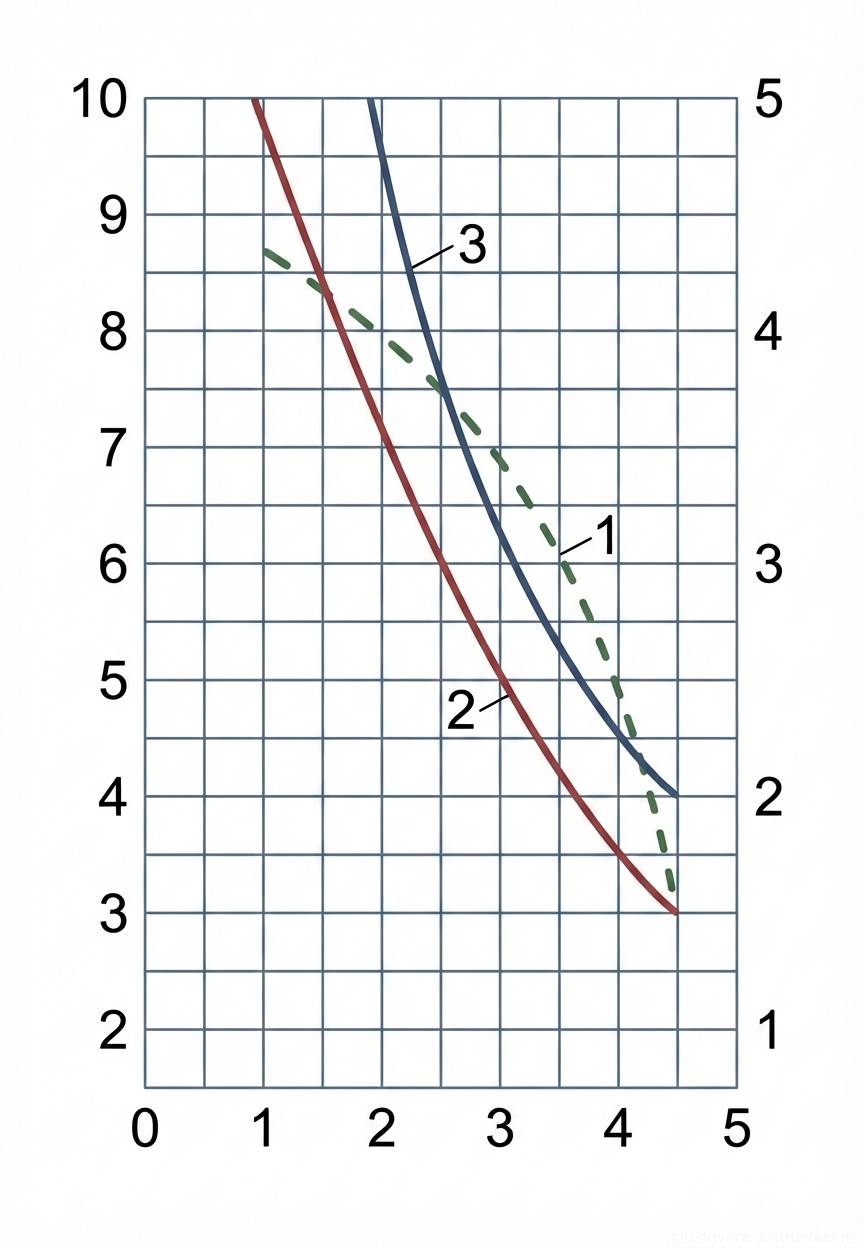
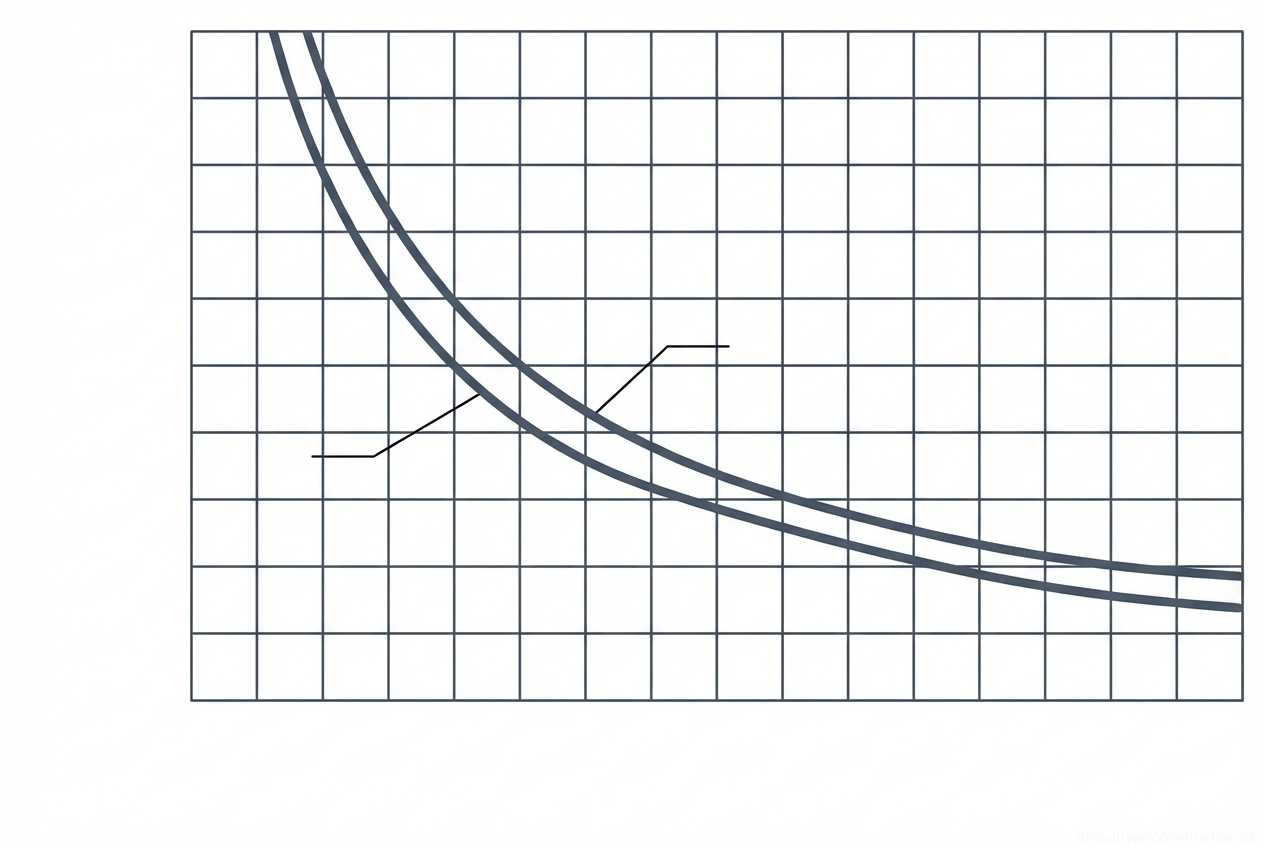
Fig. 44 — Load capacity chart illustrating the relationship between lifting capacity and boom outreach for two different operational configurations.
2Lower load capacity curve, indicating the maximum allowable load for a specific operational configuration or boom length as outreach increases.
3Upper load capacity curve, representing a higher load threshold for an alternative operational configuration or boom length as outreach increases.
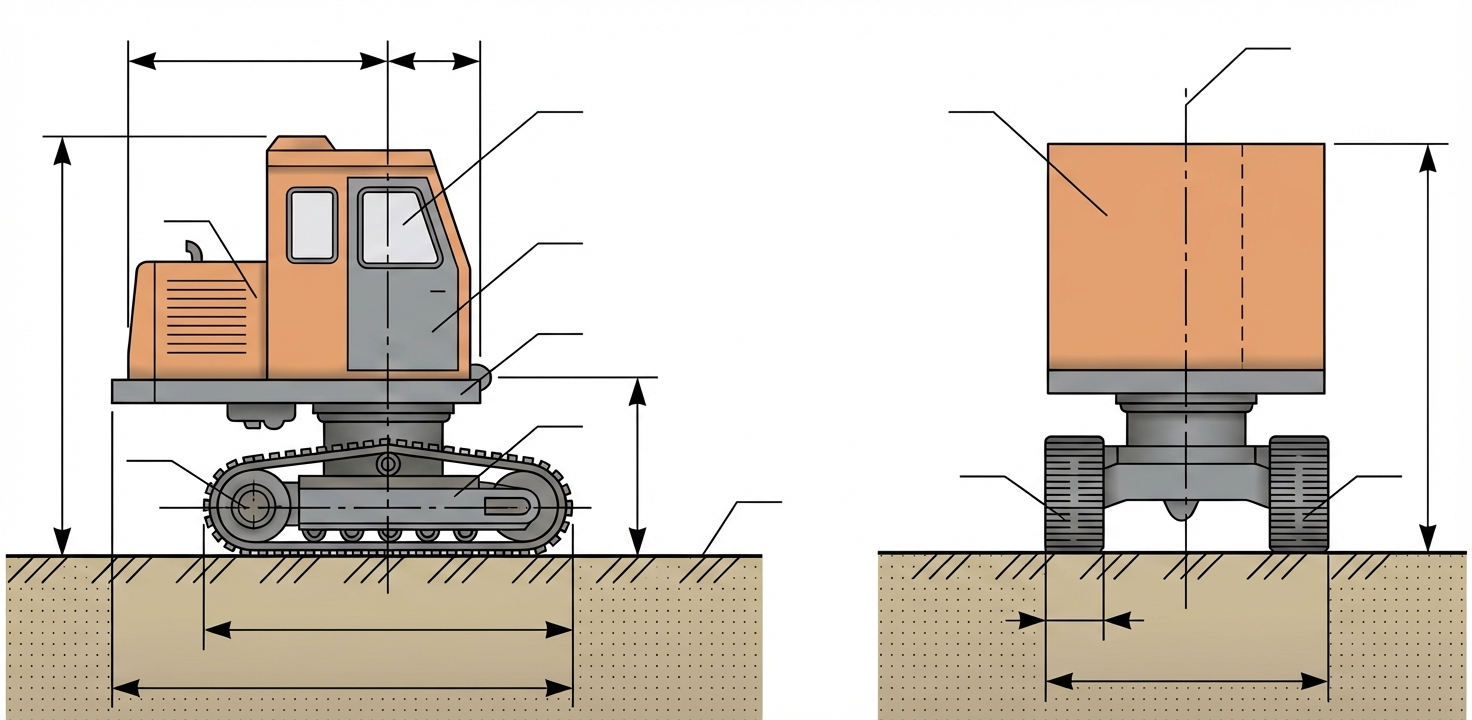
Fig. 45 — Orthographic side and rear projections of a tracked construction vehicle illustrating main structural components and overall dimensional clearances
1Overall height dimension from ground level to the highest point of the superstructure cab
2Rear overhang dimension from the axis of rotation to the rearmost point of the superstructure
3Engine compartment housing, typically fabricated from sheet steel, protecting the power plant and auxiliary systems
4Front overhang dimension from the axis of rotation to the foremost point of the operator's cab
5Operator's cab window, providing visibility for equipment operation and maneuvering
6Operator's cab door, providing access to the control station
7Slewing ring/turntable base, connecting the superstructure to the undercarriage and allowing 360-degree continuous rotation
8Clearance height dimension from ground level to the underside of the slewing platform
9Ground level/supporting surface
10Track frame assembly, supporting the crawler track system including rollers, idlers, and drive sprockets
11Rear drive sprocket or front idler wheel of the crawler track mechanism
12Crawler track length dimension (contact length or center-to-center distance of sprockets/idlers)
13Overall undercarriage length dimension, including the full extent of the track frames
14Superstructure housing/enclosure (rear view), containing the engine, counterweight, and internal machinery
15Vertical axis of rotation (centerline) of the slewing superstructure
16Track shoe width dimension, indicating the bearing width of a single crawler track
17Left crawler track assembly, comprising interconnected steel shoes for ground pressure distribution and traction
18Right crawler track assembly, symmetrical to the left track, providing propulsion and stability
19Track gauge dimension, measured center-to-center or out-to-out between the two crawler tracks
20Overall height dimension (rear view), consistent with dimension 1, measured from ground to the top of the enclosure
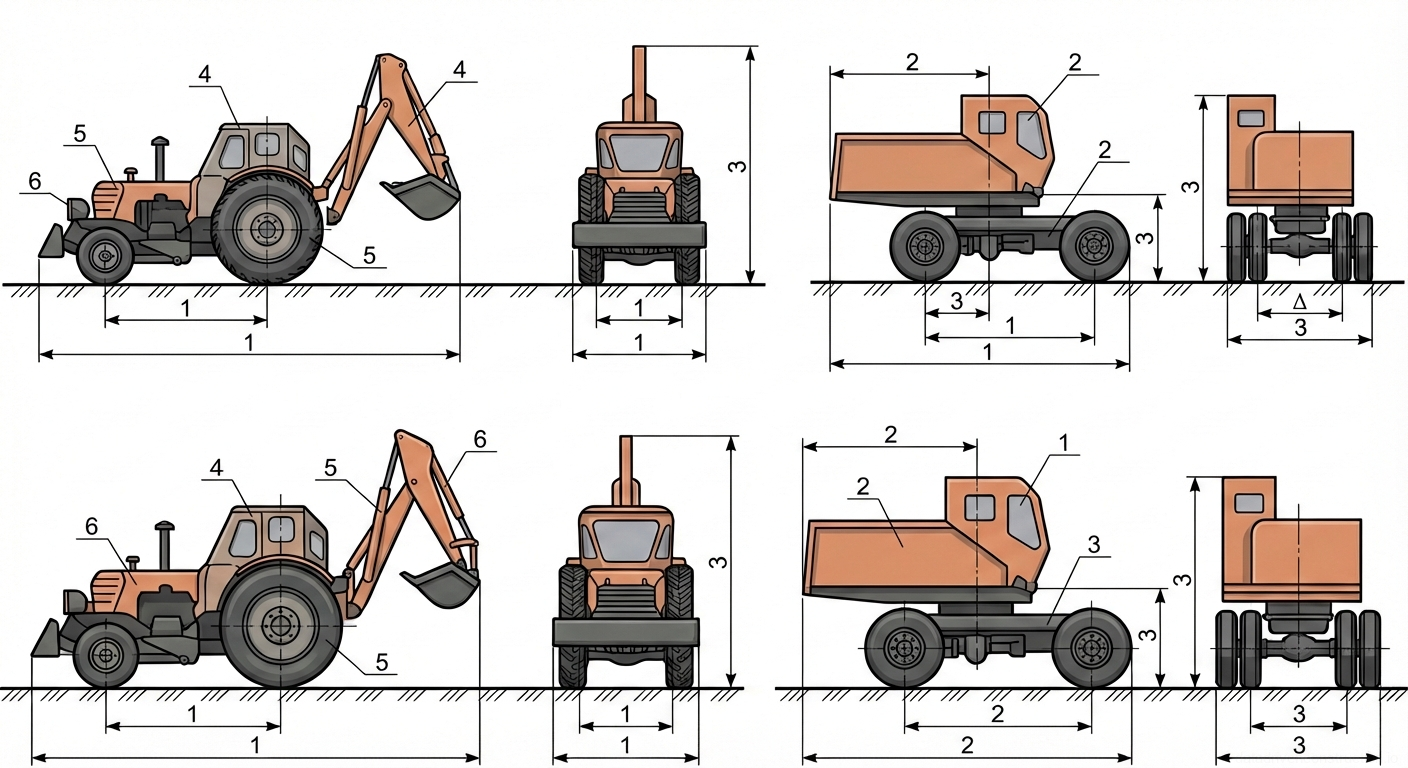
Fig. 46 — Dimensional schematics of a tractor-loader-backhoe and a specialized carrier vehicle, indicating key clearance and operational measurements
1Dimensional lines indicating overall length (L), wheelbase (Г), and track width (Д) of the equipment, critical for turning radius and spatial clearance analysis.
2Dimensions related to the carrier's upper structure, including the length of the rear dump body (A) and the cab assembly, detailing the payload containment area.
3Vertical and transverse dimensions including overall height (H), height to articulation points (В), and overall width (B), defining the maximum envelope of the vehicle.
4Operator cab structure of the tractor-loader-backhoe, providing rollover protection (ROPS) and visibility for operation.
5Rear drive wheel of the tractor, equipped with agricultural or industrial traction tires for off-road mobility.
6Front engine housing and steering axle assembly of the tractor, housing the power unit and providing directional control.
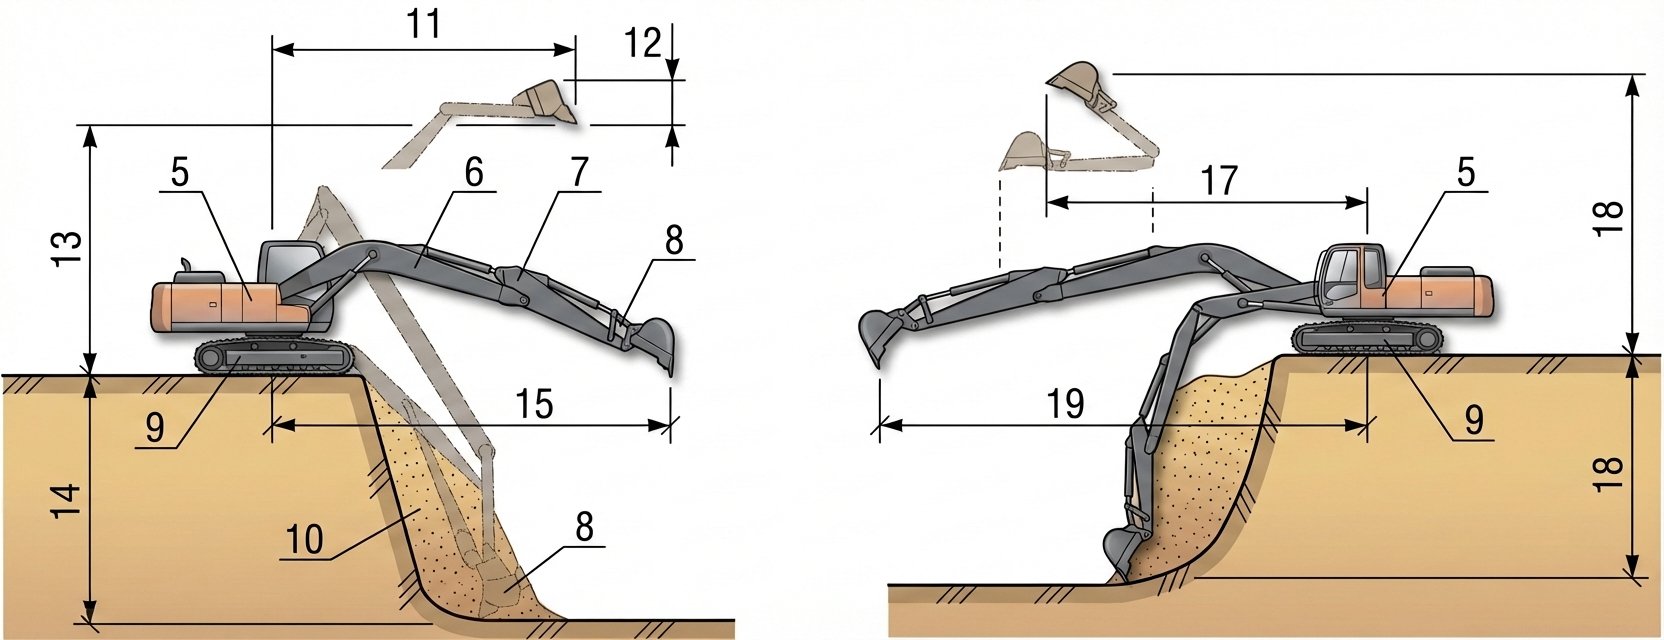
Fig. 47 — Operational diagrams of hydraulic excavators detailing working ranges for backhoe and front shovel attachments
5Excavator upper structure/cab - Houses the operator, engine, and hydraulic pumps, capable of rotating on the undercarriage
6Boom - Main structural arm of the excavator, connected to the upper structure, providing vertical reach and lifting capability
7Stick (Arm) - Secondary arm connecting the boom to the bucket, controlling the crowding (digging) motion
8Bucket - The digging implement attached to the stick, used for excavating and loading material
9Crawler undercarriage - Tracks and frame providing stability and mobility on varied terrain
10Excavation face/trench profile - The cut profile showing the depth and slope of the excavated area
11Dumping radius (R1) - Maximum horizontal distance from the axis of rotation to the bucket teeth during the dumping phase
12Clearance height (h) - Minimum vertical clearance required for the bucket to safely dump material into a hauling unit
13Maximum dumping height (H1) - Maximum vertical distance from ground level to the bucket teeth during dumping
14Maximum digging depth (H) - Maximum vertical distance the bucket can excavate below the track level
15Maximum digging radius (R) - Maximum horizontal distance from the axis of rotation to the bucket teeth at ground level
17Front shovel dumping radius (R1) - Horizontal reach of the front shovel configuration during dumping
18Front shovel digging height/depth (H/H1) - Maximum vertical reach above and below ground level for the front shovel configuration
19Front shovel maximum digging radius (R) - Maximum horizontal reach of the front shovel configuration
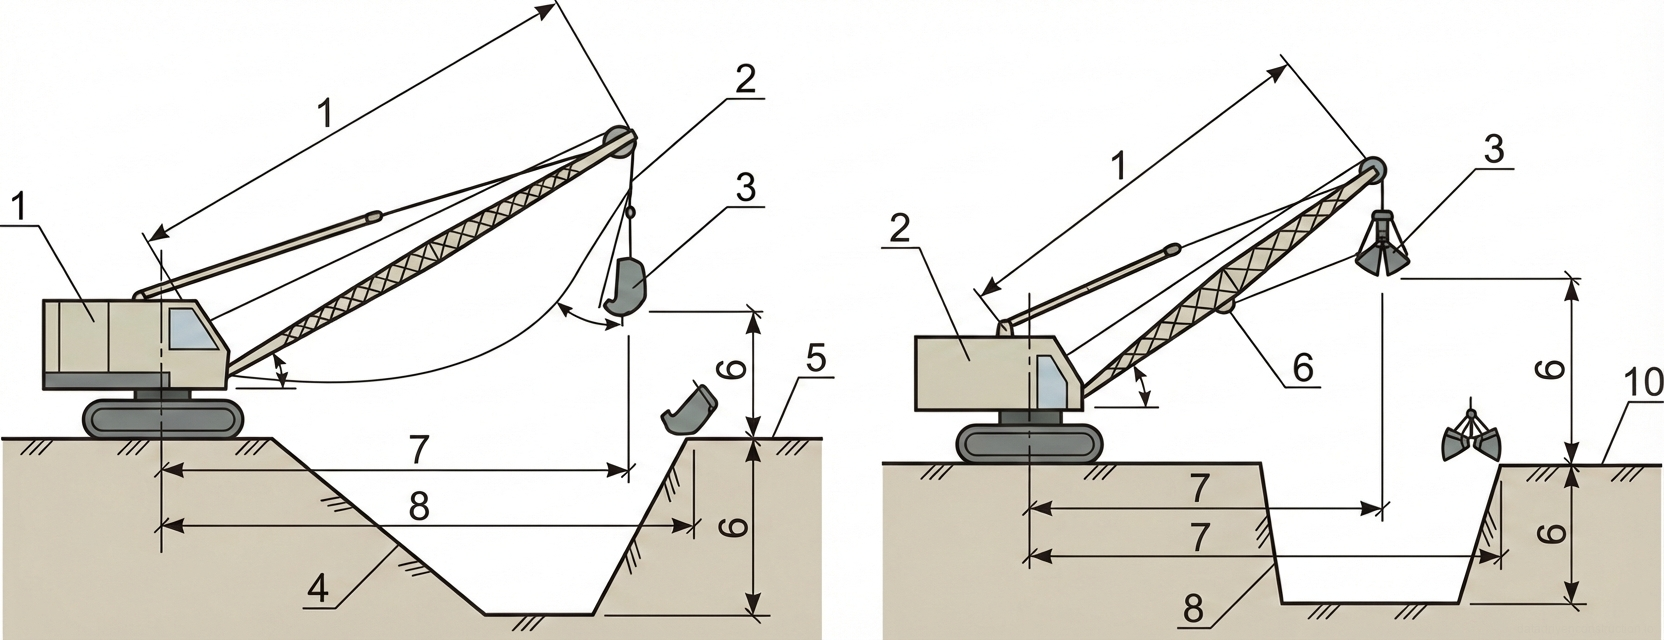
Fig. 48 — Operational diagrams of crawler-mounted excavators: dragline (left) and clamshell (right) showing key working dimensions
1Excavator boom length (A), defining the maximum reach and lifting geometry of the machine
2Hoist cable system, controlling the vertical movement of the bucket
3Dragline bucket (left) and clamshell bucket (right), the primary earthmoving attachments
4Excavation profile or slope, determined by the soil type and digging depth
5Ground level (operating surface) from which the excavator operates
6Maximum digging depth (H) and maximum dumping height (H1), critical parameters for pit excavation and truck loading
7Dumping radius (R1), the horizontal distance from the axis of rotation to the bucket discharge point
8Maximum digging radius (R), the maximum horizontal reach from the axis of rotation to the excavation point
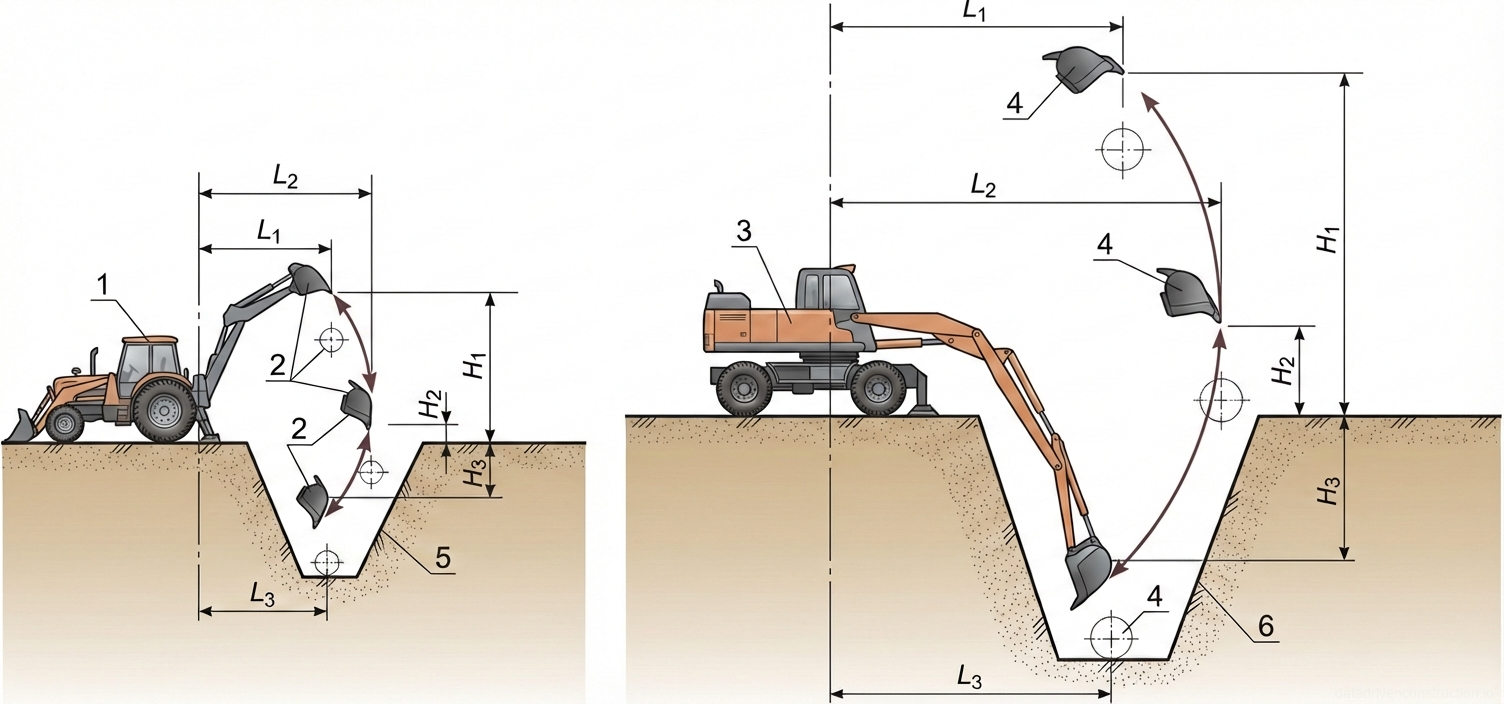
Fig. 49 — Operational diagrams and kinematic parameters of tractor-mounted and wheeled single-bucket excavators
1Tractor-mounted backhoe excavator unit (base machine EO-2621 or similar), positioned at ground level for trench excavation.
2Bucket trajectories for the tractor-mounted excavator, showing various positions during the digging and lifting cycle.
3Dedicated wheeled hydraulic excavator, positioned at ground level, demonstrating an extended working range.
4Bucket trajectories for the wheeled excavator, illustrating positions at maximum depth, mid-lift, and maximum dumping height.
5Trench profile excavated by the tractor-mounted machine, defined by specific depth (H3) and reach parameters.
6Trench profile excavated by the wheeled machine, showing a deeper and wider excavation capability compared to the tractor-mounted unit.
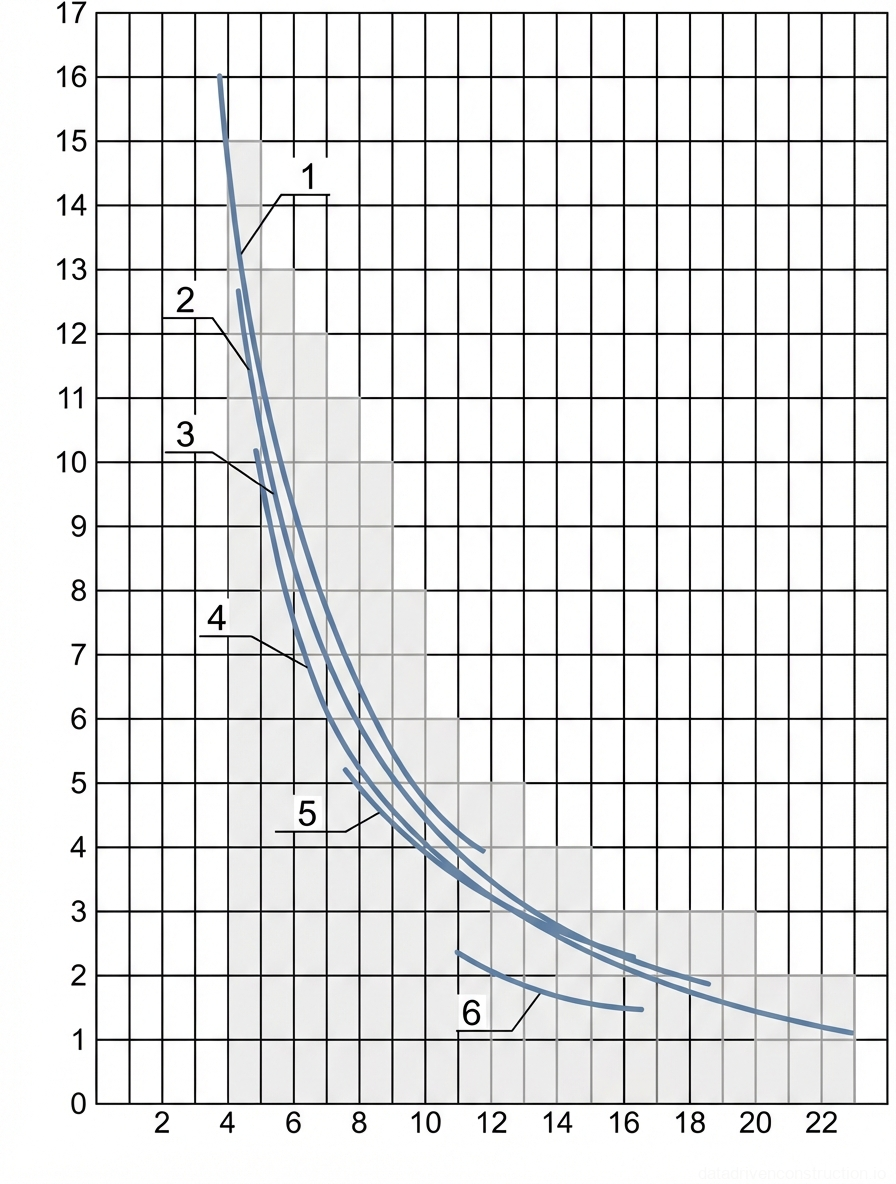
Fig. 50 — Crane load chart illustrating lifting capacity versus working radius for multiple boom configurations
1Load curve representing the highest lifting capacity profile, starting at approximately 16 tons at a 4m radius and decreasing as the reach extends.
2Load curve for a secondary boom configuration or operating mode, showing slightly reduced lifting capacity compared to curve 1 across the mid-range radii.
3Load curve for another boom configuration, demonstrating a lower capacity profile, starting at approximately 10 tons at a 5m radius.
4Load curve indicating a further reduced capacity, typically corresponding to a longer extended boom or jib configuration.
5Load curve showing one of the lower capacity profiles for extended reach operations.
6Load curve representing the lowest lifting capacity, likely for the maximum boom extension or a specific lightweight lifting attachment, starting around 2 tons at an 11m radius.
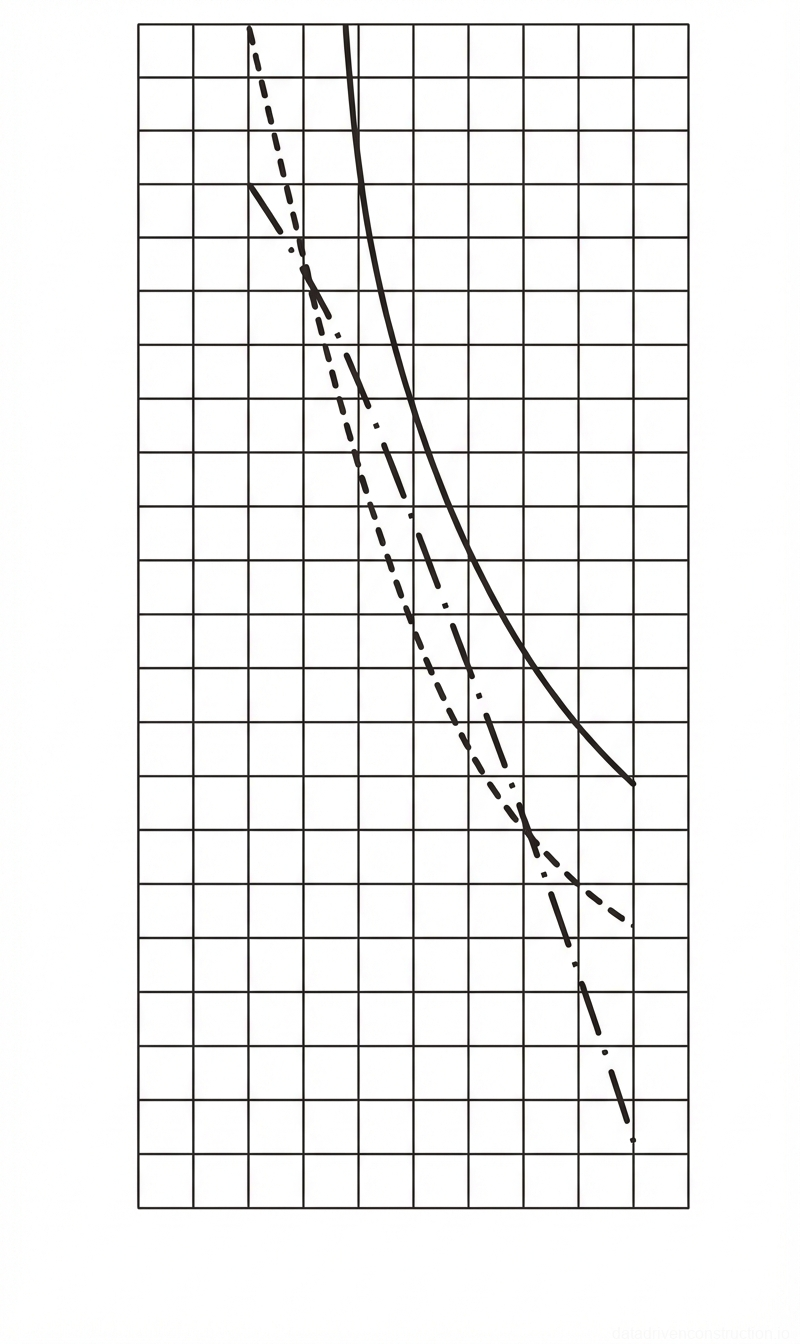
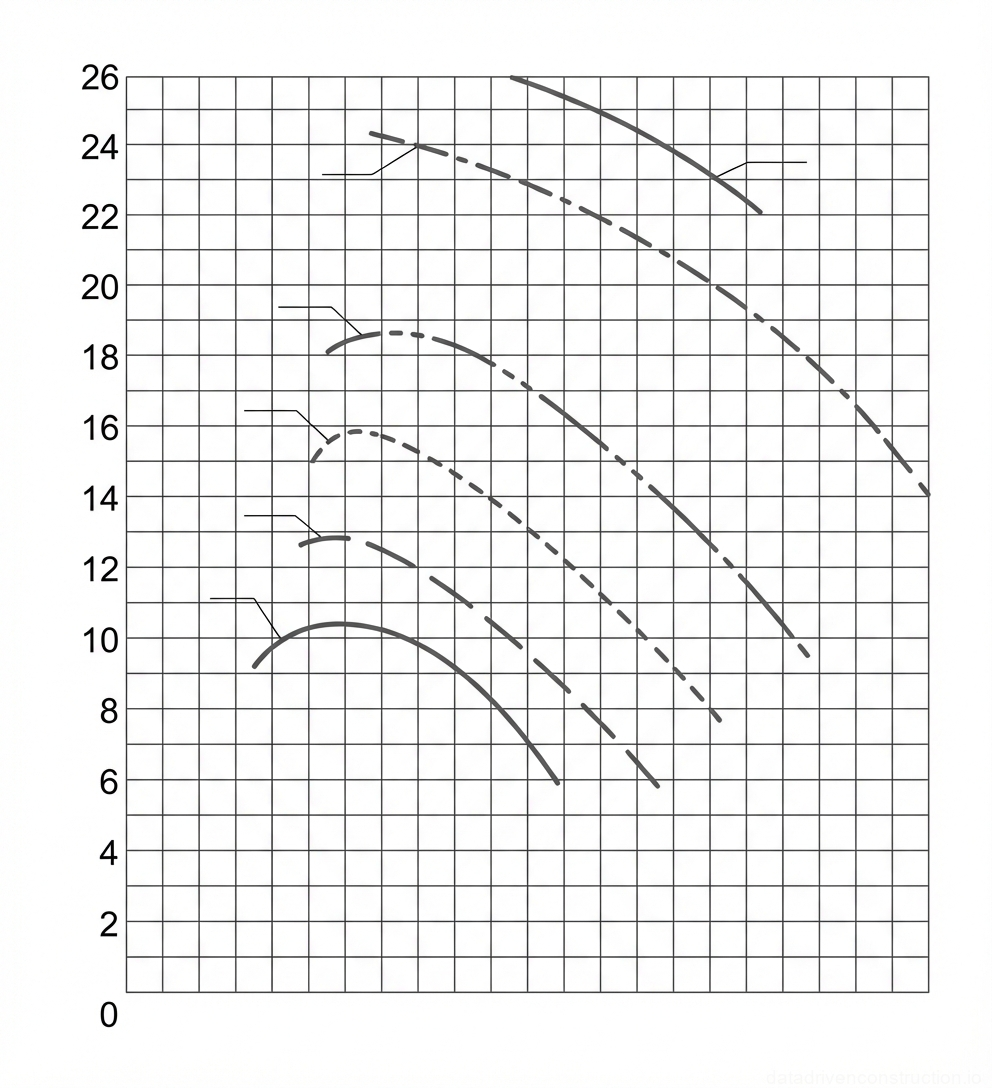
Fig. 51 — Kinematic chart illustrating hook lifting height curves relative to jib outreach for multiple crane boom configurations
1Solid line curve denoting the hook lifting height profile for the basic or fully retracted main boom configuration, defining the lowest vertical operational envelope.
2Dashed line curve indicating the hook lifting height profile for the first intermediate boom extension, providing an initial increase in vertical reach.
3Dash-dot line curve representing the hook lifting height profile for a secondary intermediate boom extension, offering mid-range elevation capabilities.
4Dashed line curve defining the hook lifting height profile for a fully extended or near-maximum main boom configuration.
5Dash-dot line curve denoting the hook lifting height profile for a boom configuration utilizing an auxiliary jib attachment, characterized by a higher base elevation.
6Solid line curve establishing the hook lifting height profile for the maximum possible boom and jib combination, defining the absolute upper limit for vertical reach.
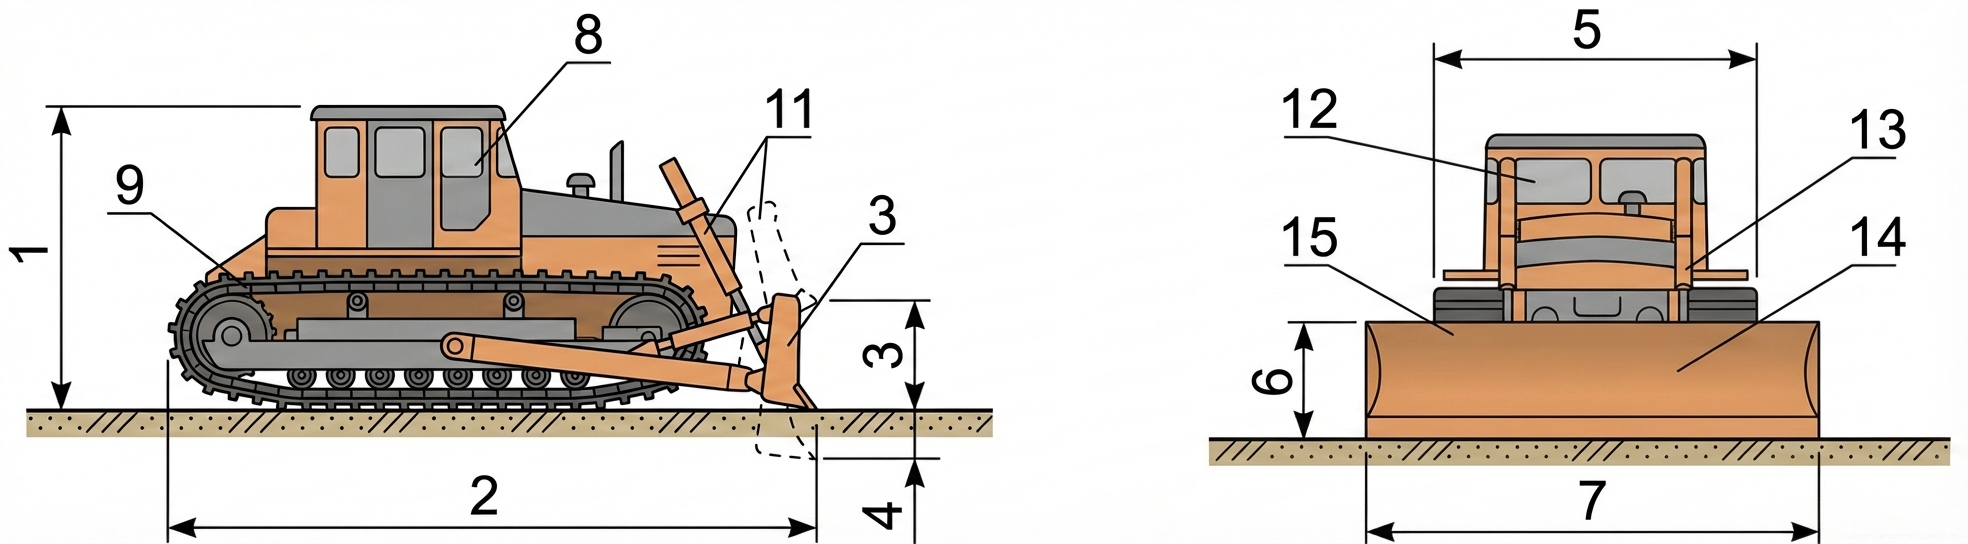
Fig. 52 — Orthographic projection and technical dimensions of a crawler-type bulldozer
1Overall vertical clearance dimension (H), measured from grade to the top of the ROPS operator cabin.
2Total length dimension (L), extending from the rear of the track assembly to the tip of the blade resting on grade.
3Maximum blade lift height dimension (h), defining the upper limit of vertical clearance for transport and material piling.
4Maximum digging depth dimension (h1), representing the maximum penetration limit of the cutting edge below ground level.
5Overall tractor width dimension (B), measured across the outer edges of the crawler tracks.
6Moldboard height dimension (h2), determining the vertical pushing capacity of the front attachment.
7Moldboard width dimension (l), defining the total clearing and sweeping width of the blade.